By looking at imagery metadata, interviews, meeting minutes of space treaties, and technological failures, Uncharted is an ongoing research inquiry into the rhetoric of the contemporary globe—and by what mechanisms it came to be.
Cartographic representation and geographic databases are used every day by millions of people to move across familiar environments, plan long-range trips, cross national borders, reach shores of unknown countries in hope of a better life, or scan oceanic seabeds for untapped resources. Once directly connected to a physical activity on the territory—often accomplished through a coordinated parade of military and state presence—, Earth surveying is now the result of the remote observation by a vast array of orbiting sensors.
Disconnected from the fate of our surroundings (and bound to an almost-eternal life out of the harsh conditions that constantly reshape the same ground they monitor), the global remote sensing apparatus is made of objects, facilities, and data owned by nation states and private corporations, and managed through an intricate network of ground stations. It conceals its different agendas under the smooth, colour-corrected surface of satellite imagery, embedded in the metadata of the global digital mosaic like a footnote to the wonders of the contemporary geographic omniscience—while delivering a profitable picture of a borderless world. On the screen where the geographic information is delivered and experienced, all that counts is a smooth navigation experience: we can go everywhere—and we belong anywhere—on the evenly accessible surface criss-crossed by GPS-calculated paths, where political and natural features are erased under the uniform roaming of a positioning dot.
Uncharted aims to map this secretive territory, in order to unfold the complexity behind the technologies and systems that are shaping the way in which we see and experience our world. The first outcome of this investigation is an interactive installation and a series of experimental visualisations produced for After Belonging, Oslo Architecture Triennale 2016. The infrastructure behind contemporary cartography has been enquired in three phases and correspondent case studies: Sensing, by visualising Landsat programme’s operations between 1972 and 2016; Processing, by looking at Svalbard Satellite Station and various features of satellite imagery at extreme latitudes; Rendering, by cutting a vertical section of Google Maps’ digital sky. The making-of and the design of this installation are presented here.

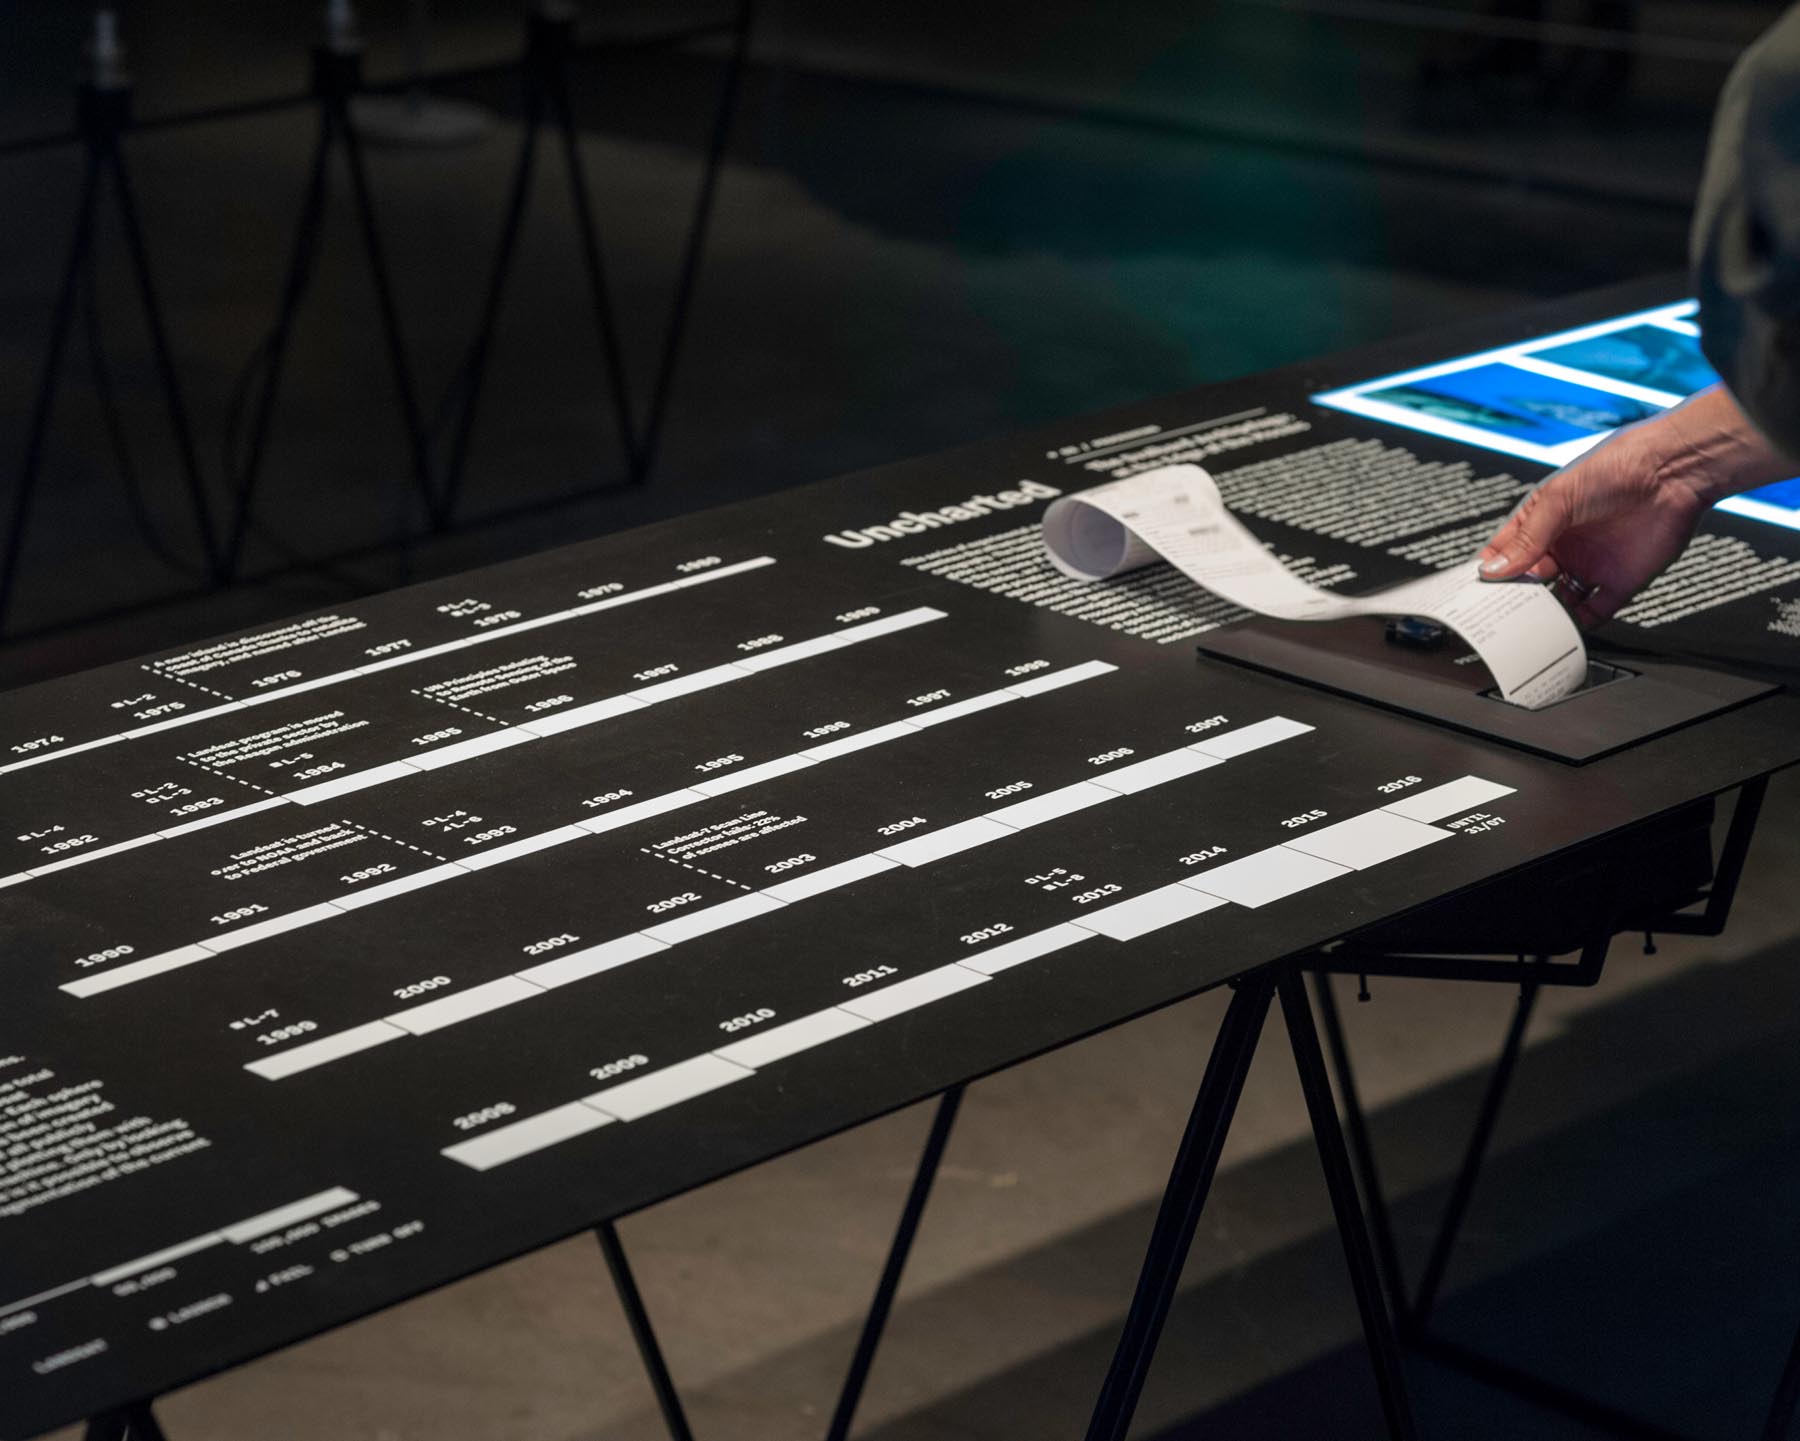
Landsat global imagery coverage, 1972-2016 (data source: USGS)
Since 1972, at least one Landsat spacecraft has been continuously circling between 900 and 700 km above the Earth’s surface. As the longest-running programme for remote sensing, Landsat products are still used as a benchmark to evaluate the accuracy of current geospatial imagery. The Landsat programme posed very early questions about real-time processing of vast amount of information and tackled issues about data sovereignty, such as the debate on the rights of sensing countries over sensed countries, leading to the ratification of UN space treaties in the late 1970s and 1980s.
The single global image of the Earth produced by Landsat is far from an unfaltering panorama of the planet: in fact, it is a mosaic of more than 60,000 images. The sensed areas vary hugely from year to year, according to a variety of reasons: needs for cartographic consolidation, weather conditions, environmental emergencies, technological compromises, military surveillance, political agenda, availability of ground receiving stations.
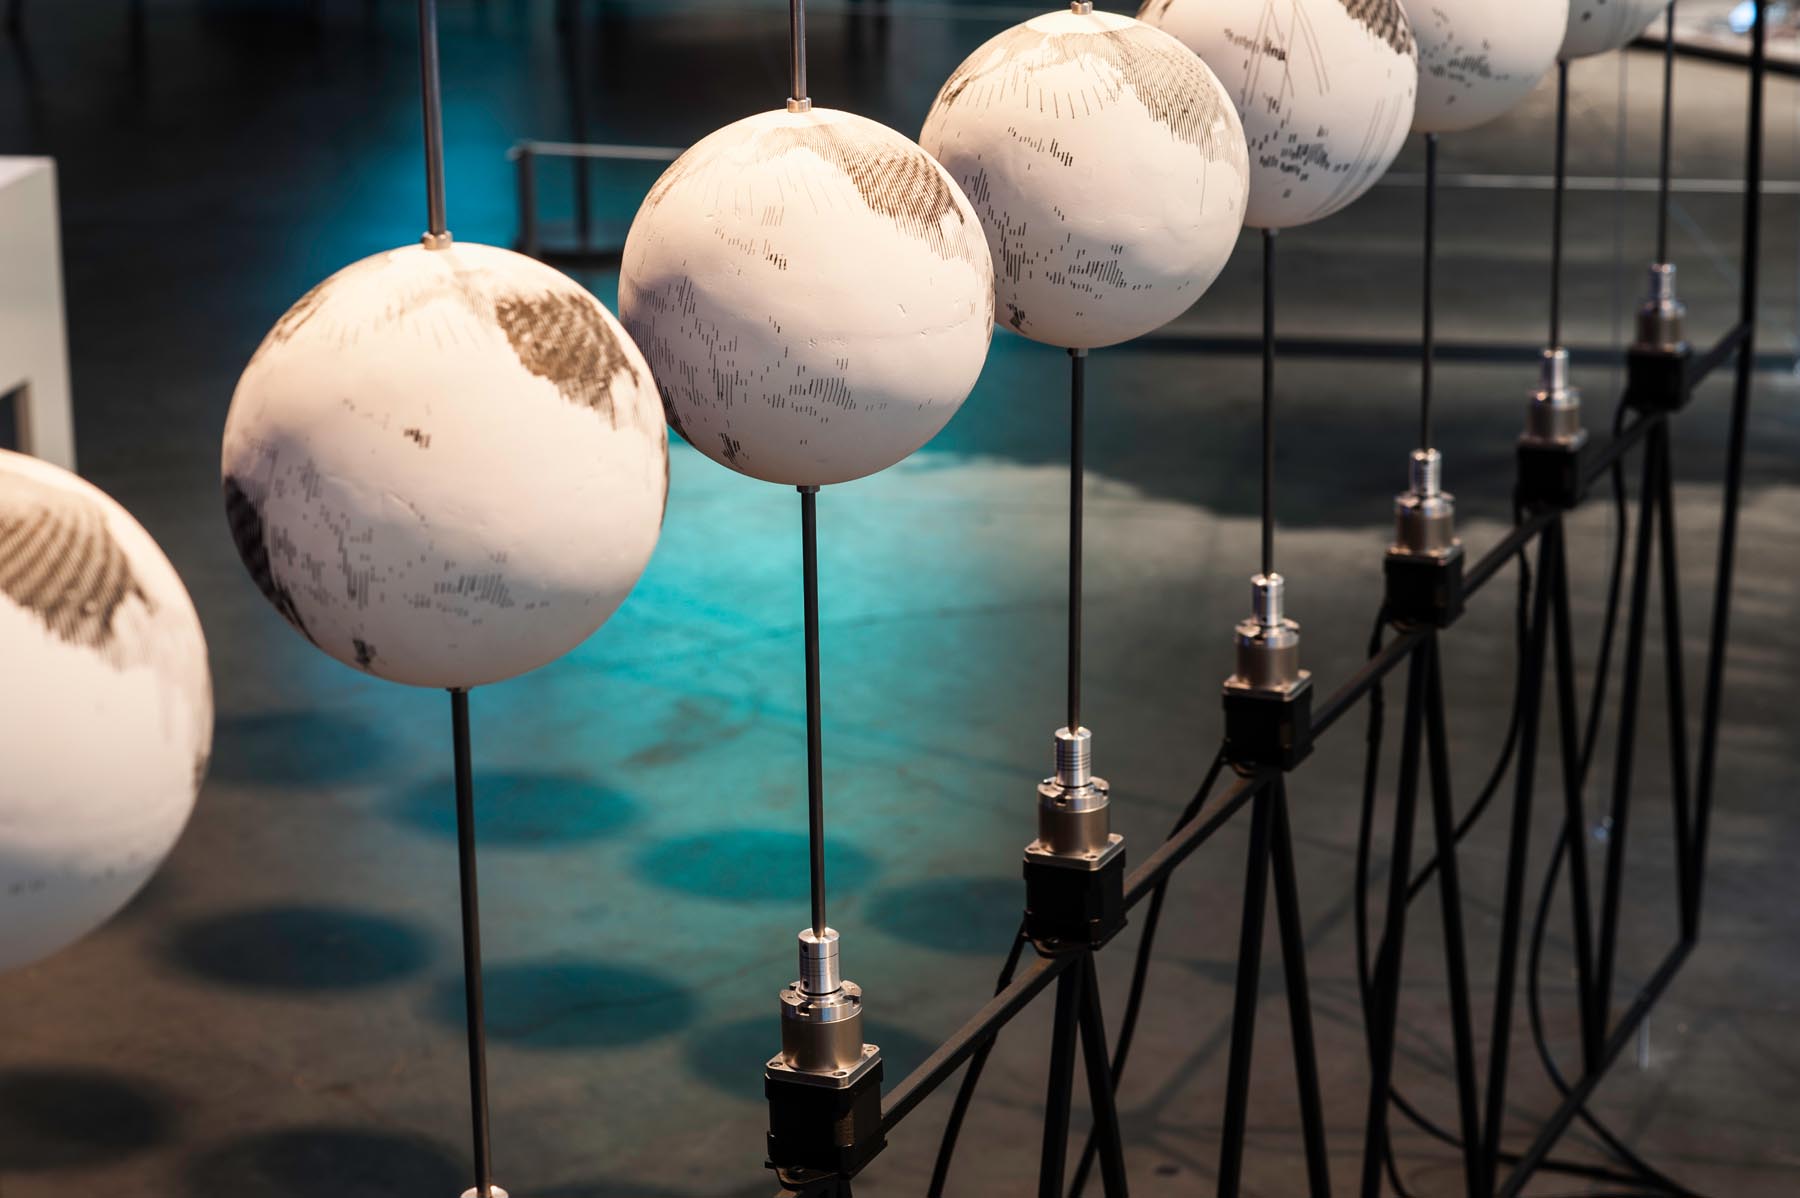
“A Panoptic Cartography of Remote Sensing” displays the amount and distribution of all the imagery collected by the Landsat programme between 1972 and 2016. A metal frame supporting a set of 45 globes in constant motion provides a comparative tool for the exploration of the data. Each globe represents the imagery available for every single year, through a visualisation of the satellite metadata along the actual Landsat orbital path. Only by looking at this series over time is it possible to observe the evolution and fragmentation of the current global mosaic, as an evidence of the biased interests (and the evolving capabilities) that determined the advance of remote sensing over the past decades.


Each globe is casted inside a rubber mold and polished by hand (photo: Mattia Balsamini)
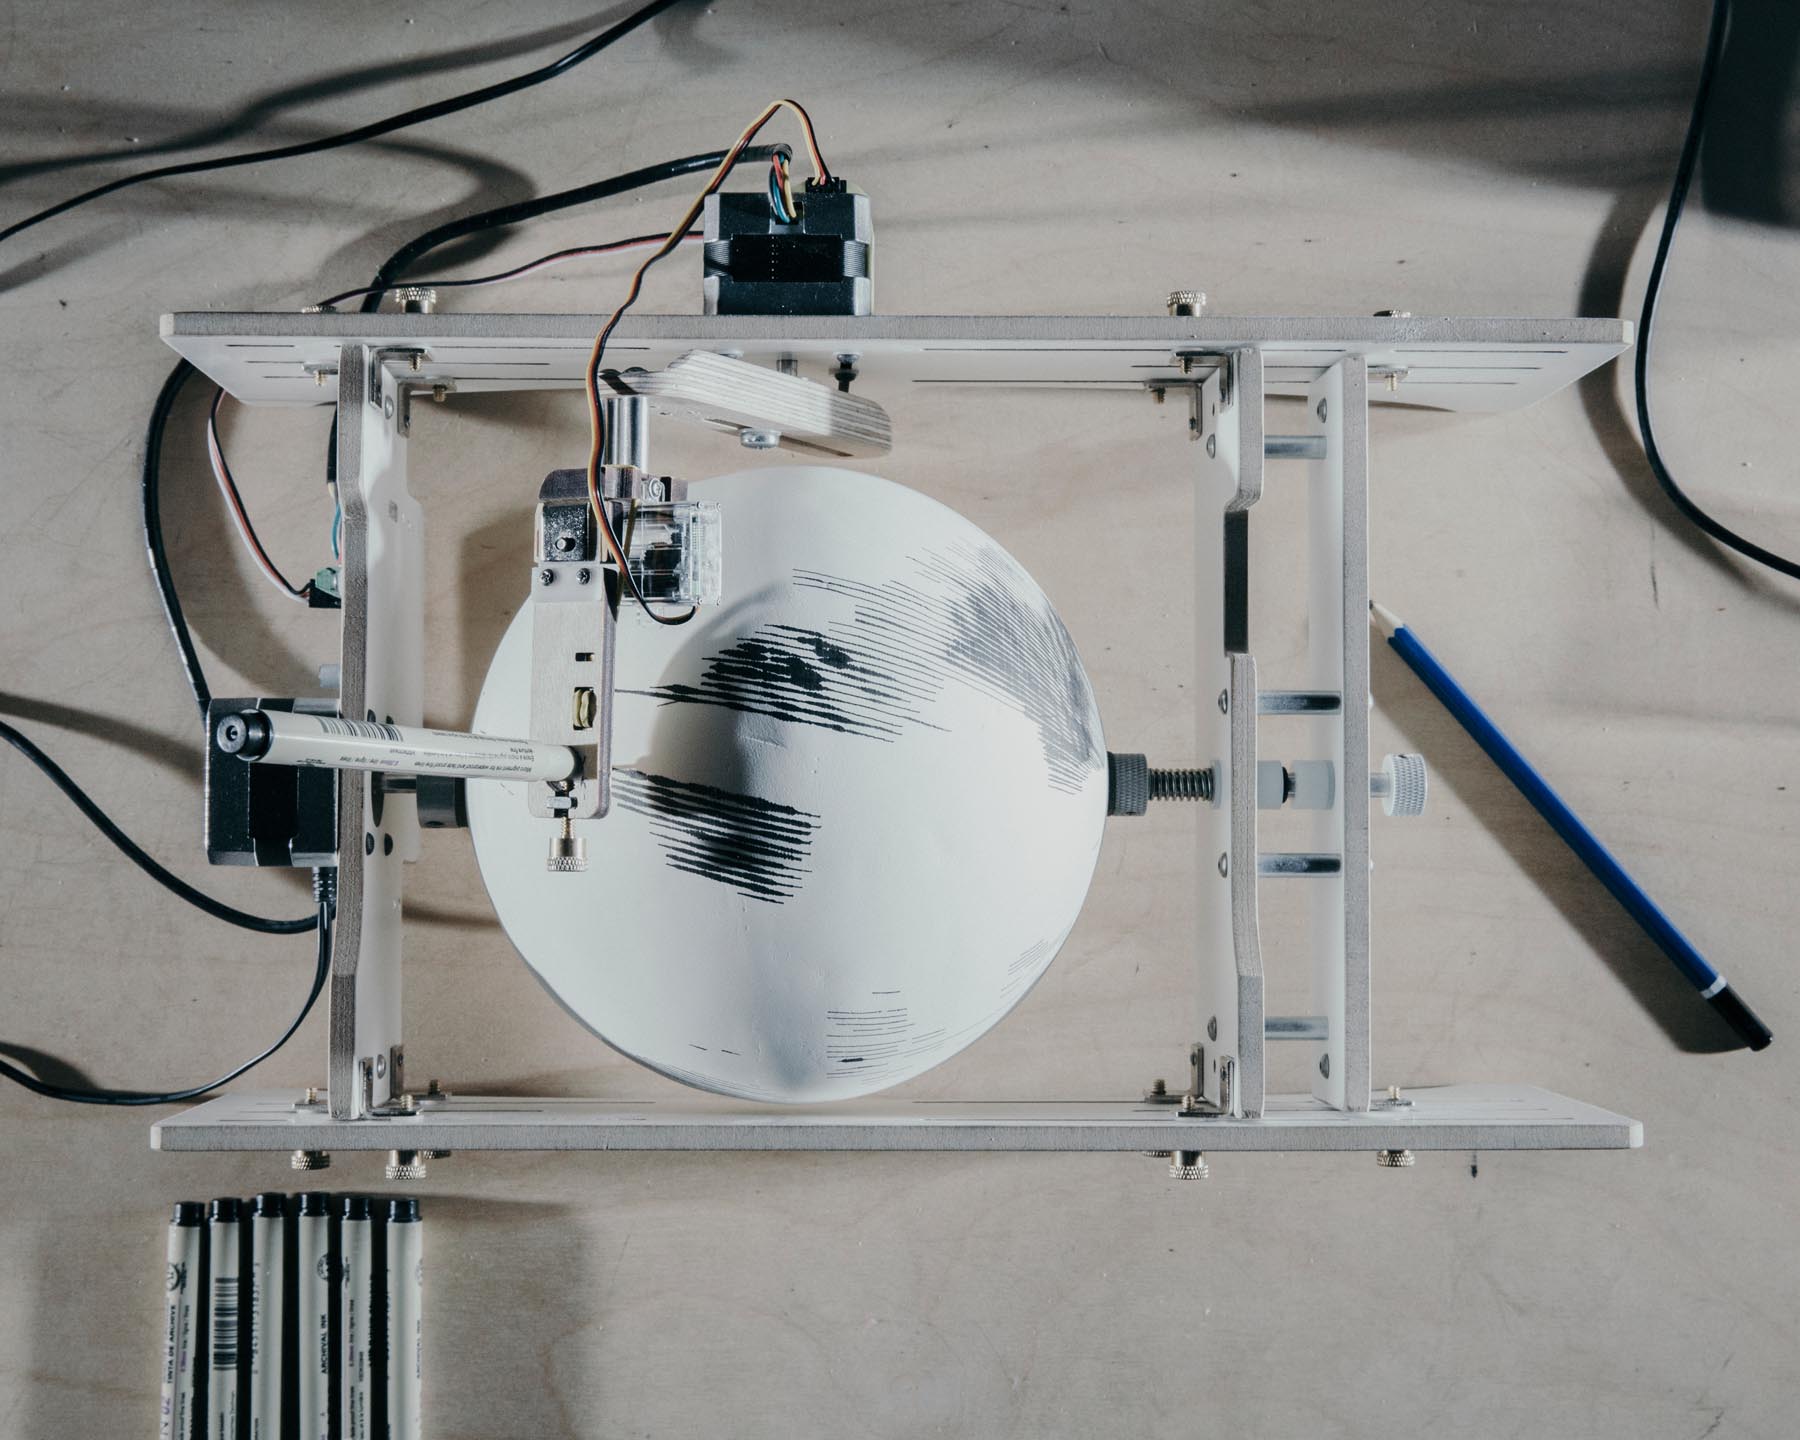
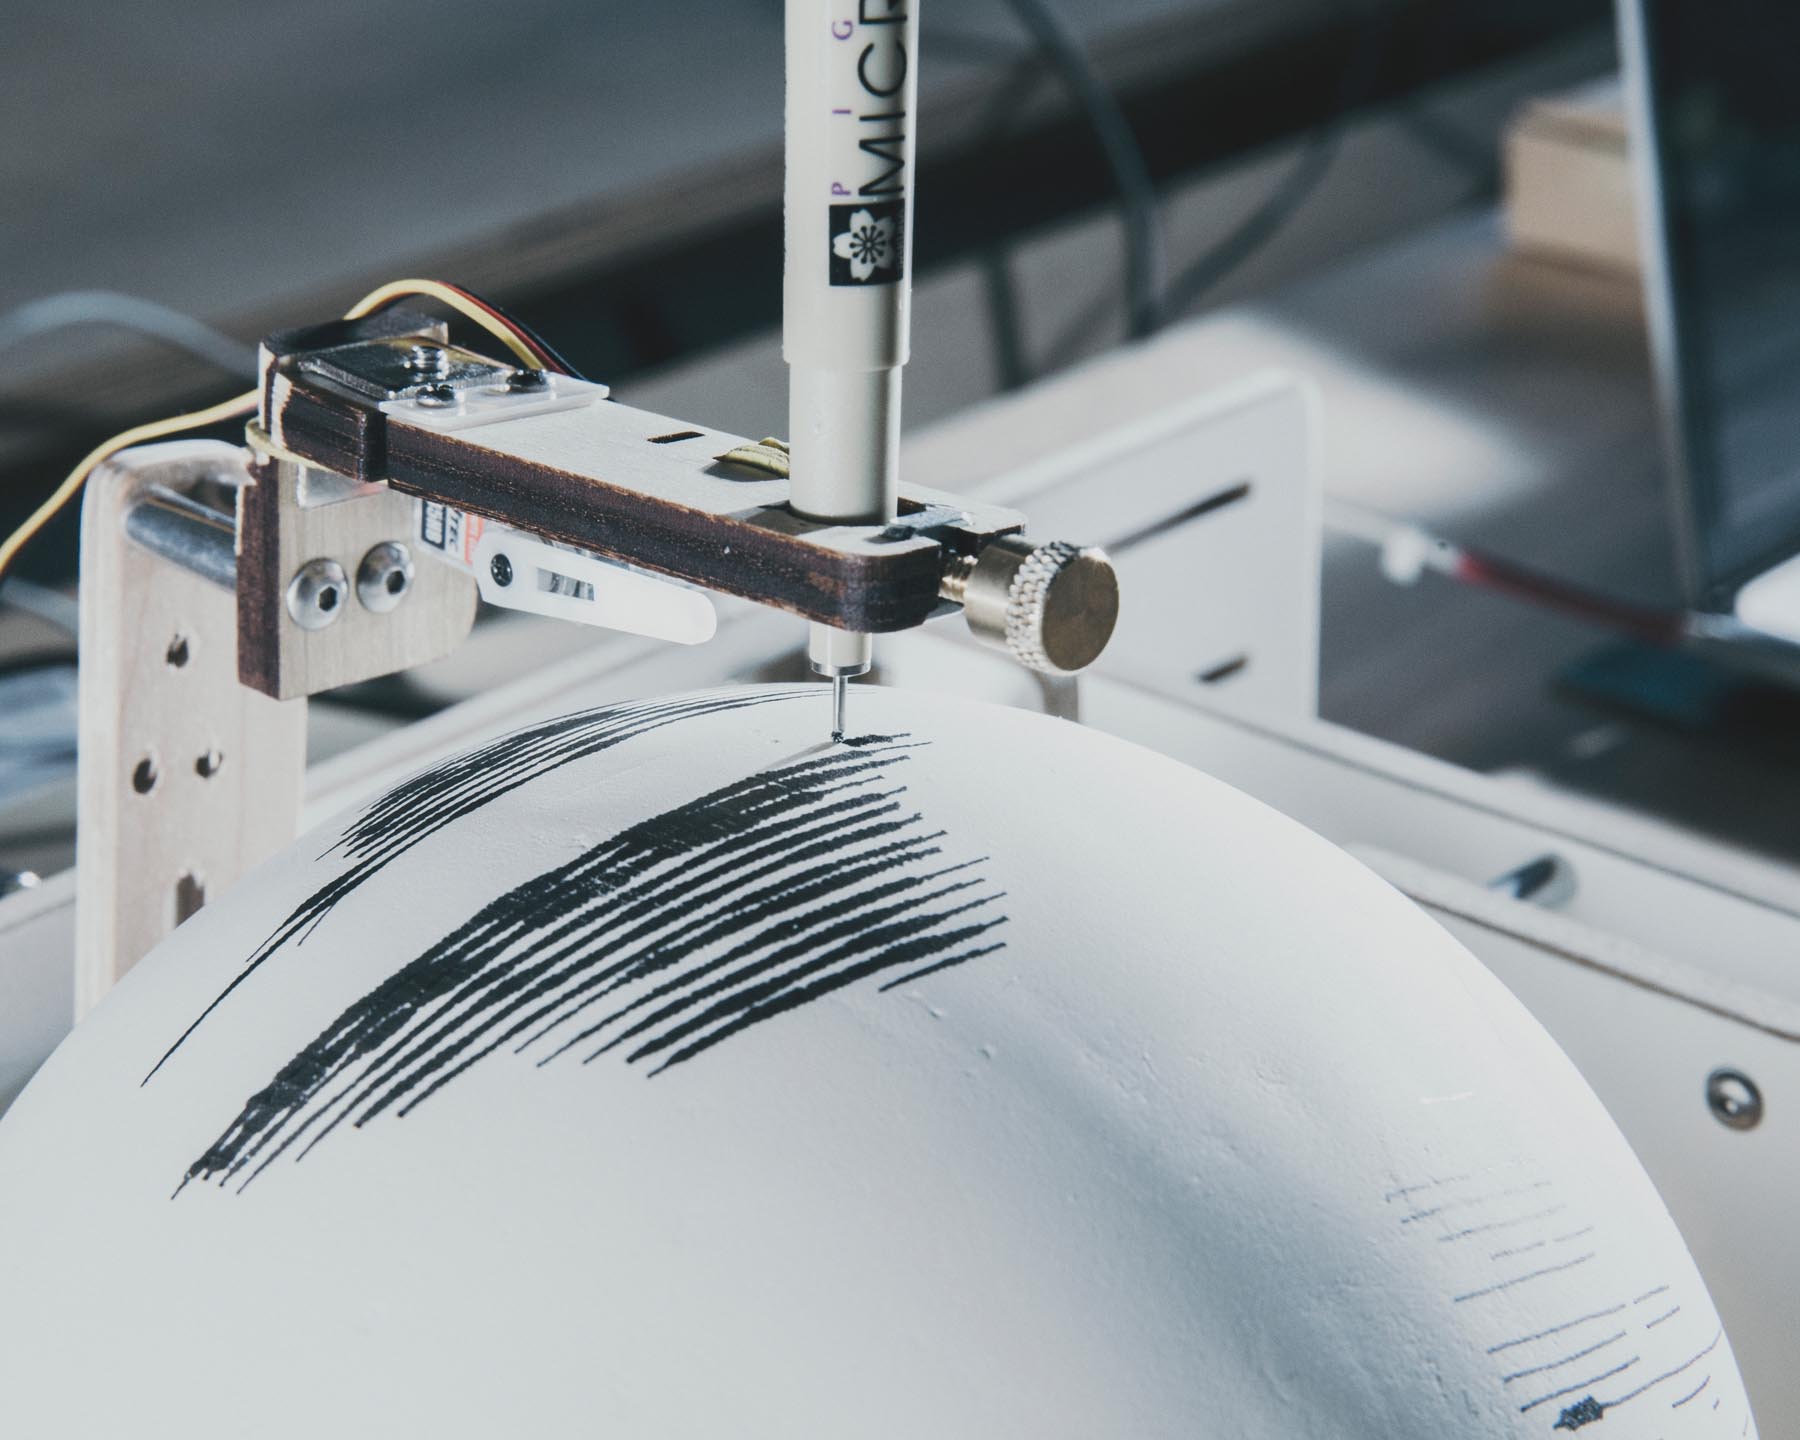
A drawing machine translates the Landsat metadata into a visualisation of the global yearly distribution of satellite imagery (photo: Mattia Balsamini)
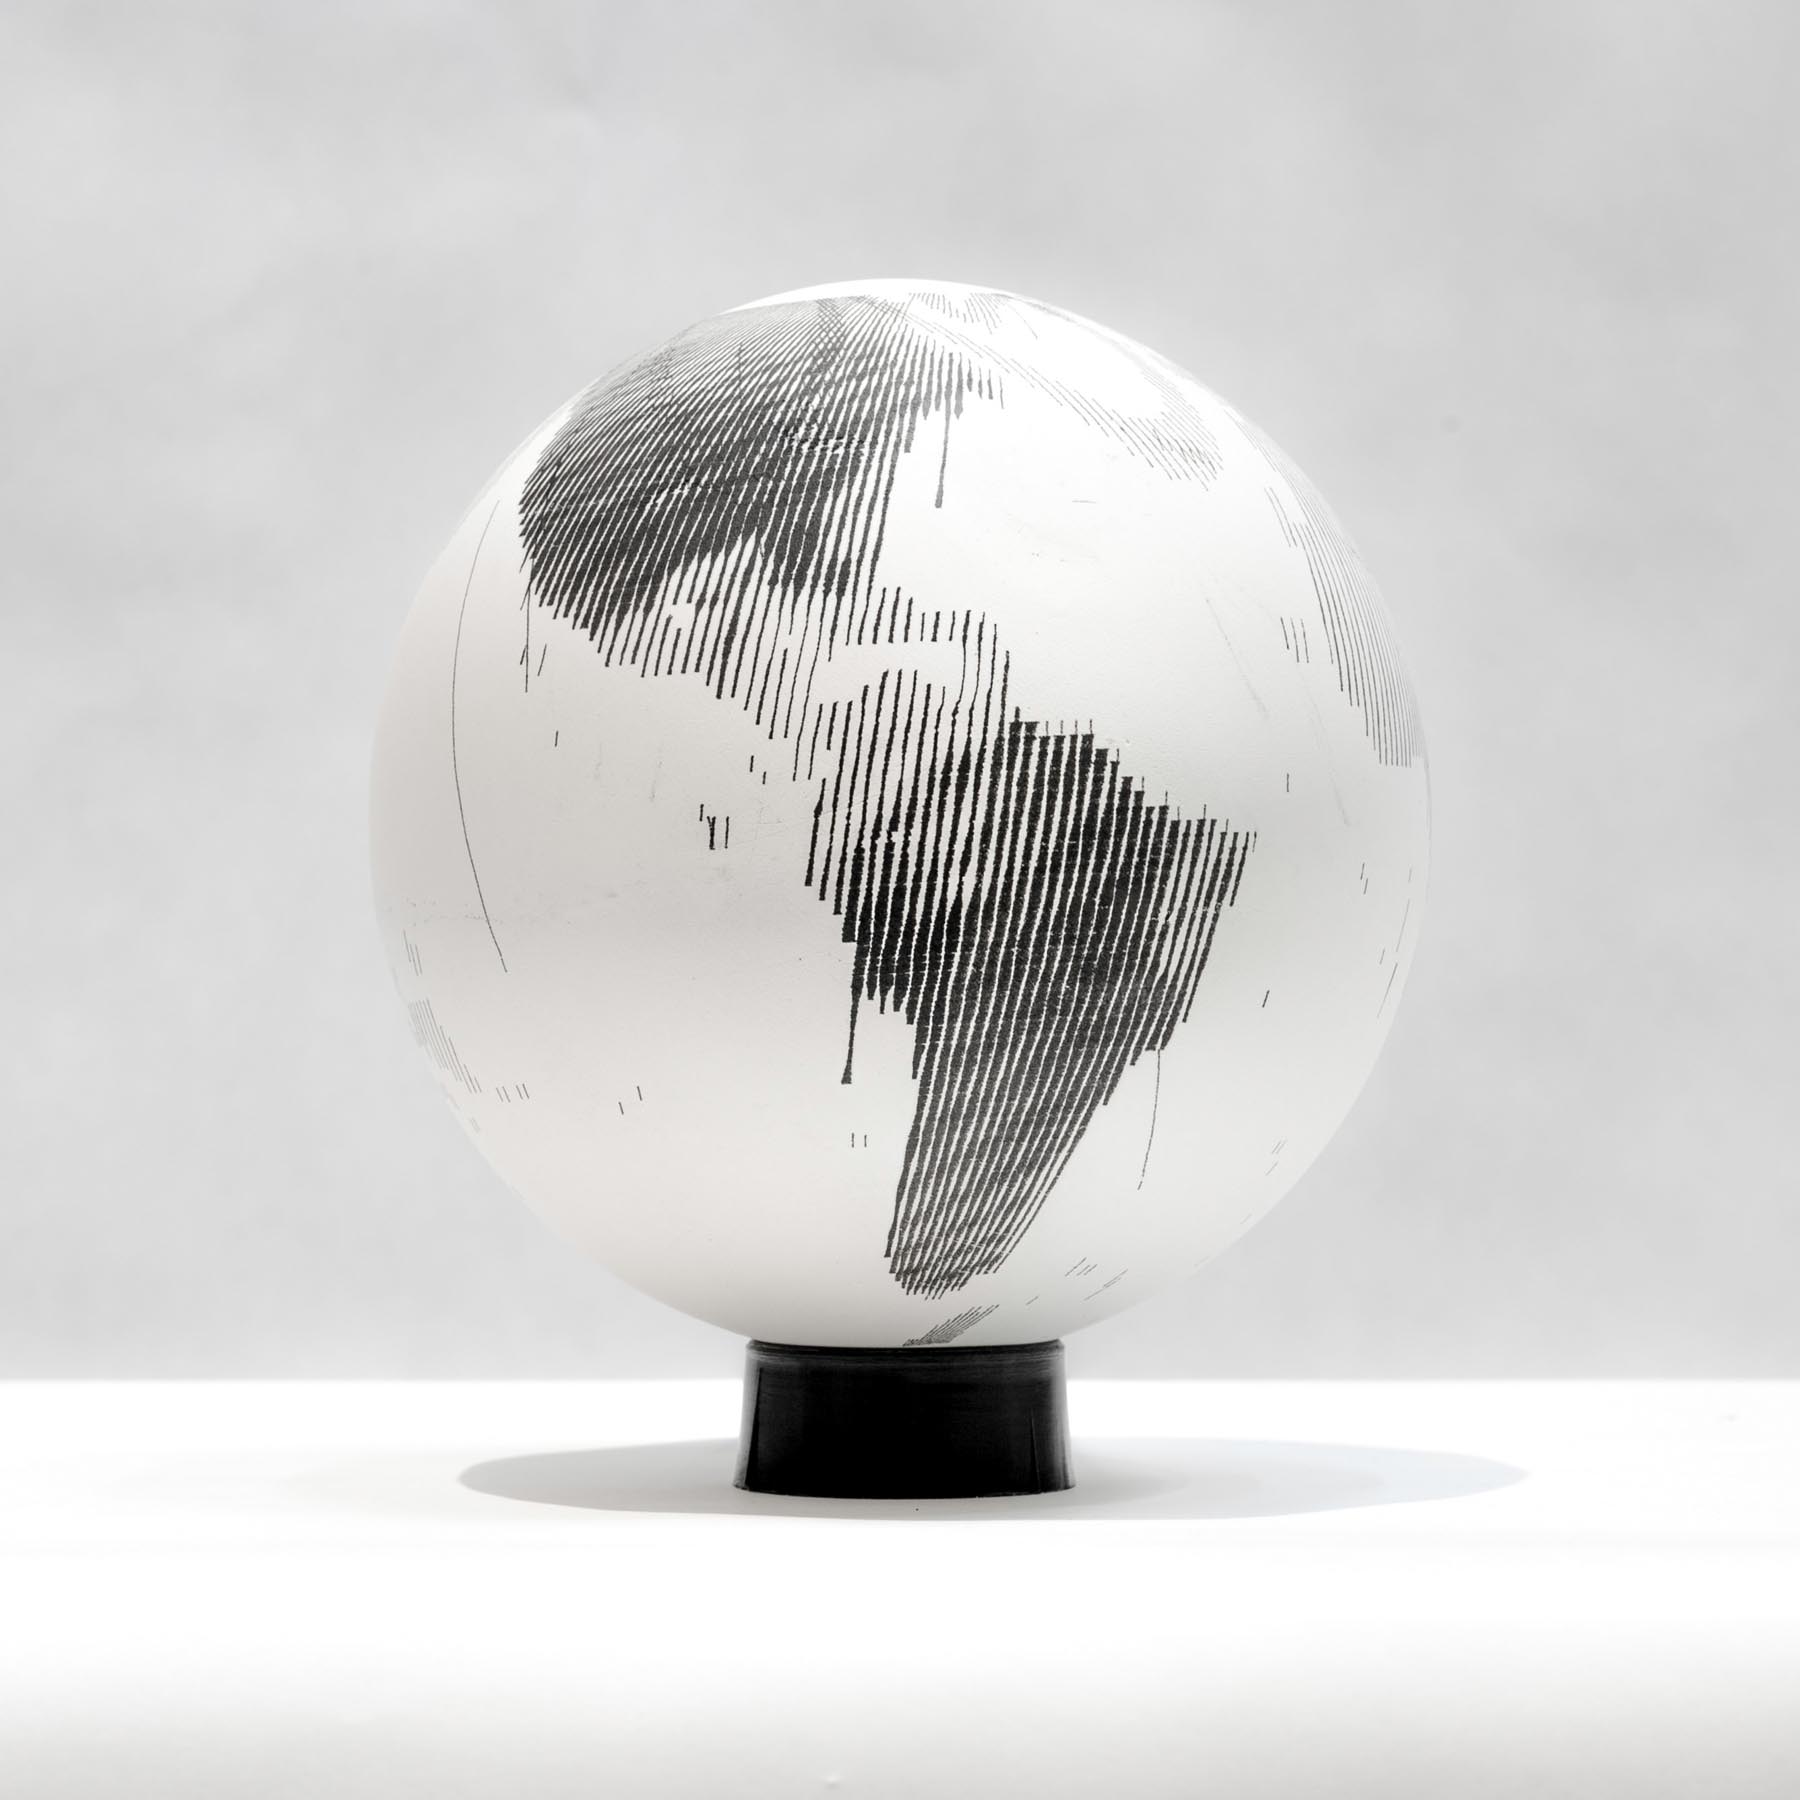
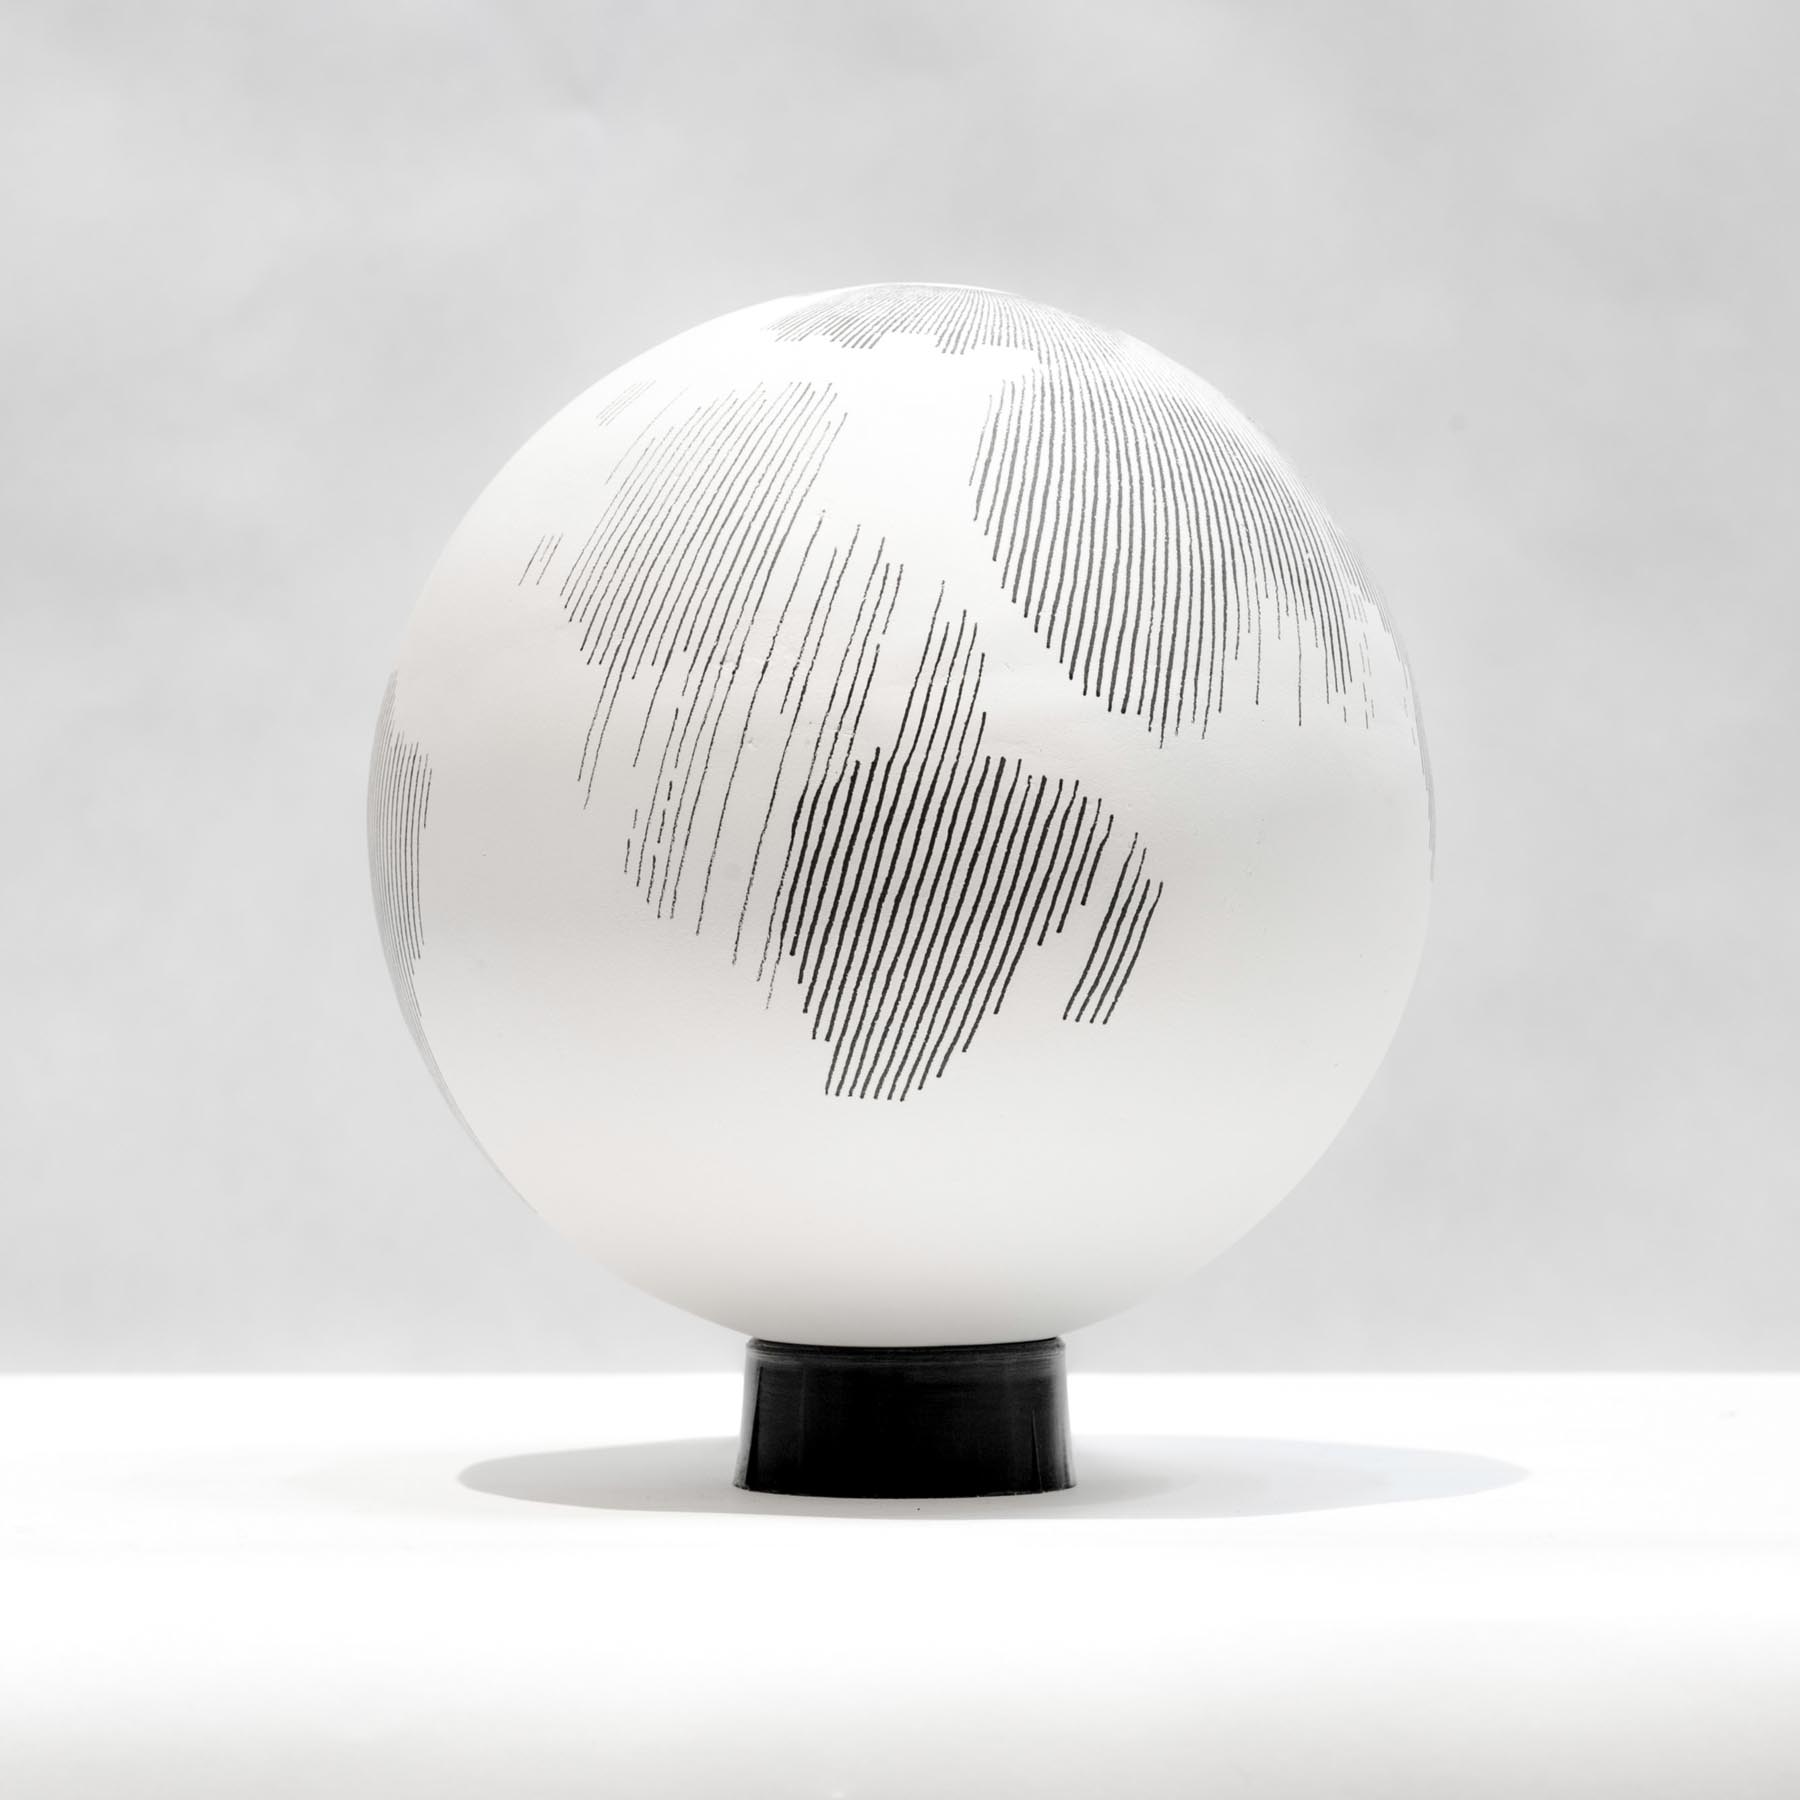
Each globe reveals the most sensed areas and the blank spots for every year of Landsat activity. The varying focus of the satellite eye can be related to historical events, technological evolution, or international agreements over the use of the collected data
All the publicly available Landsat datasets have been downloaded and parsed in order to produce a geographical representation of the imagery distribution over time, and translated into a series of maps. A drawing machine has been used to engrave the data onto the globes, which had been previously crafted by hand through a custom process of casting and polishing. The lines’ thickness—which represent the number of photos available for a given year—is originated by the increasing vibration of the robot’s arm, that hovers on the spinning globe while progressively drawing on it. A separate table provide a key for the understanding of the data and allows to get a printout of selected quotes and references that were collected during the research.
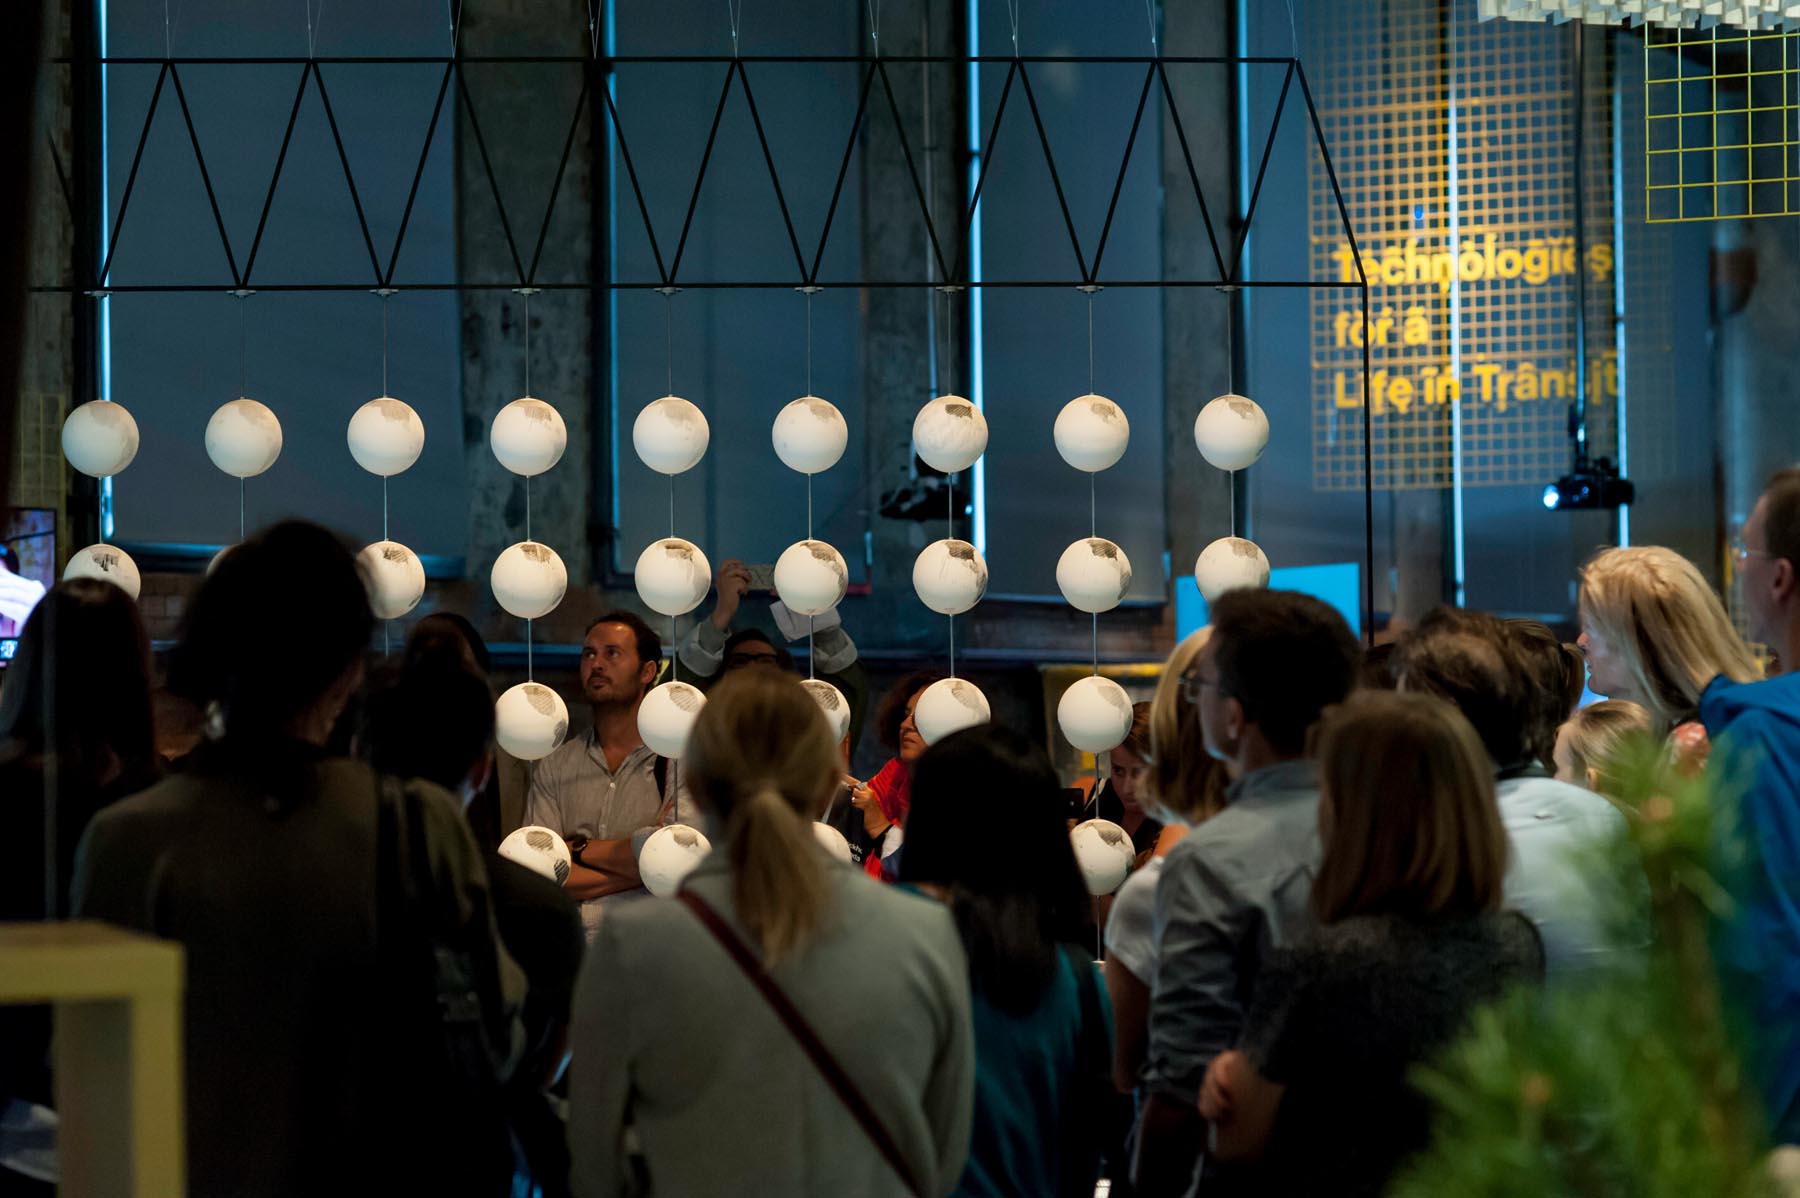
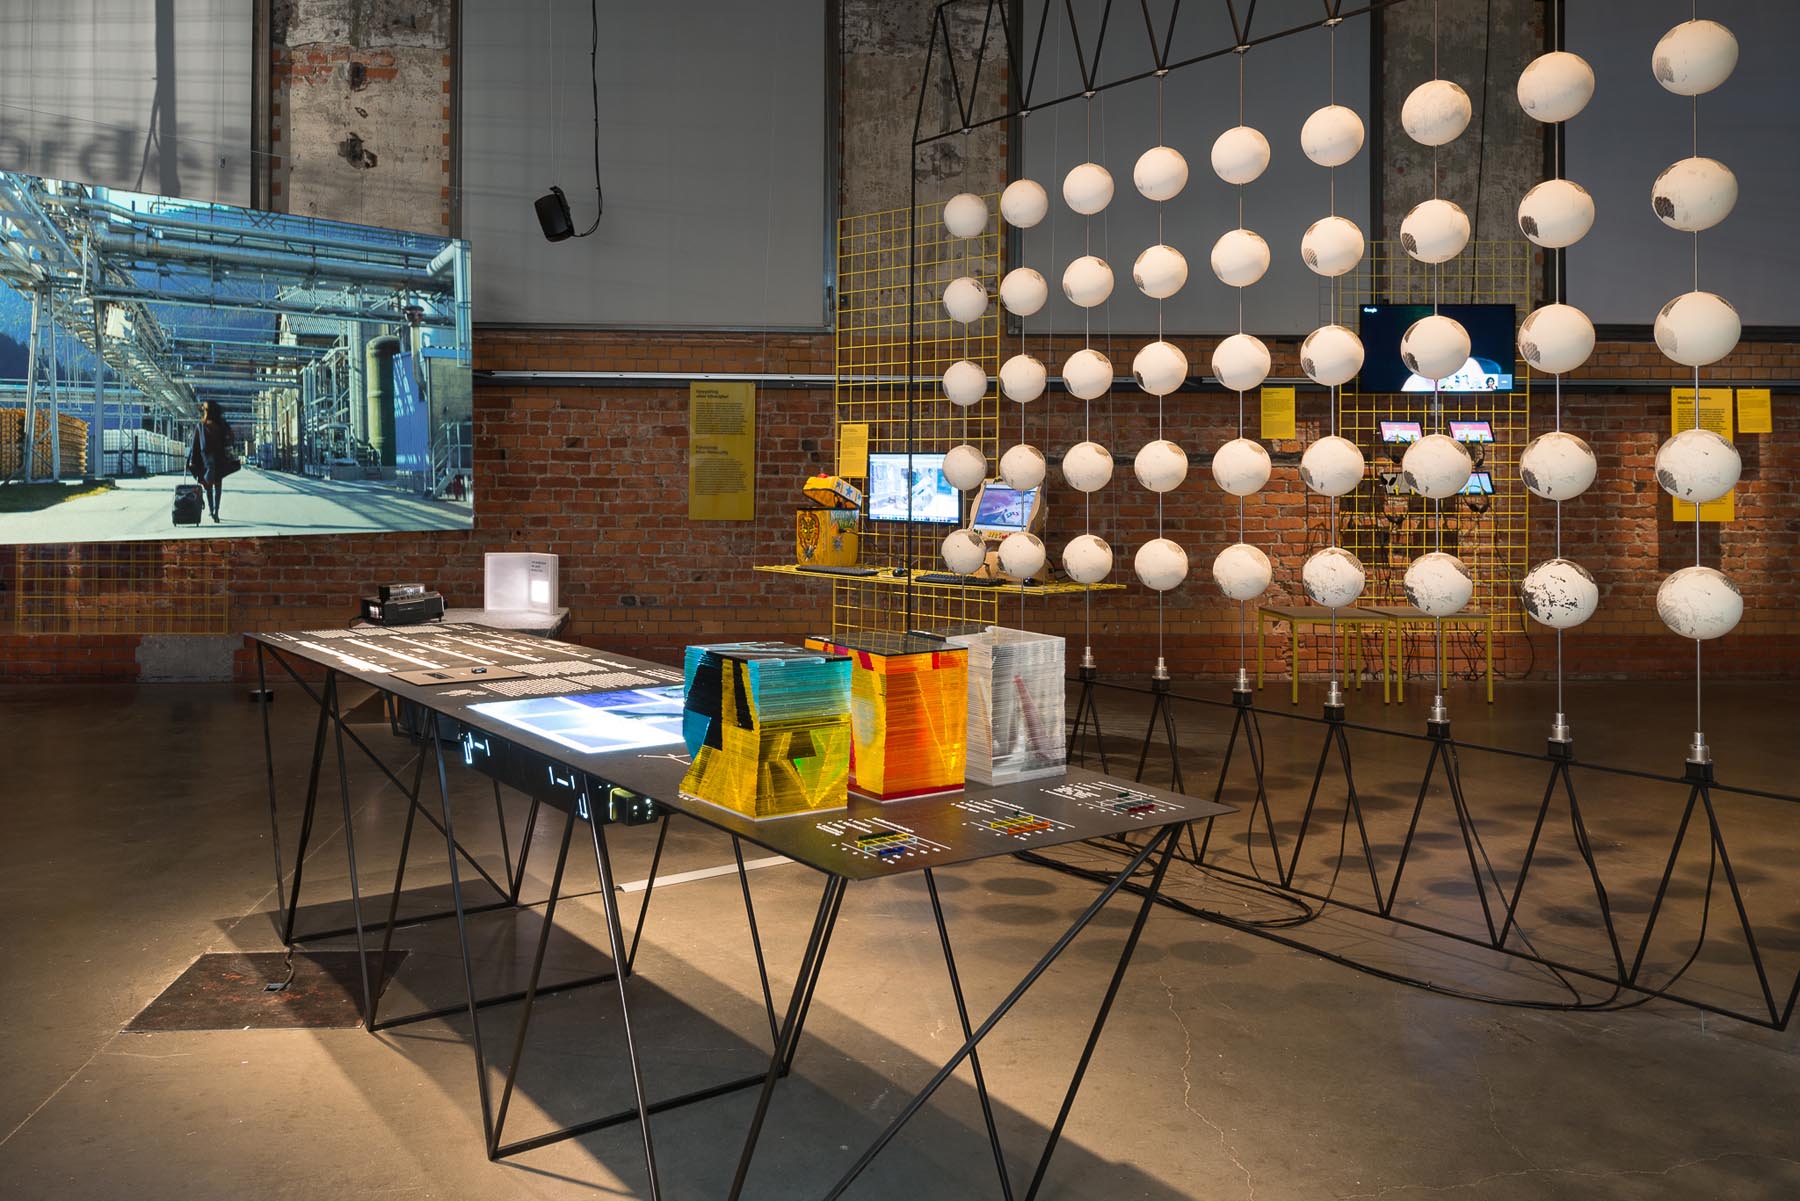
Views of the Uncharted installation as part of After Belonging, Oslo Architecture Triennale 2016 (September 8th–November 27th, 2016)
Svalbard is an archipelago situated between 74°N and 81°N in the Arctic Ocean. The Svalbard Treaty of 1920 recognises the full Norwegian sovereignty over the islands, but it guarantees equal access to their territory and resources to all the signatory nations. It also forbids any military operation on its land and waters. Mostly inhabited by mining workers from Russian and Norwegian origins during the XX century, Svalbard now hosts numerous advanced research outposts from a wide range of different nationalities. It’s both a global research centre for the study of climate change and the upper atmosphere, and an emerging centrepiece of the new power race for influence and resources in the High Arctic.
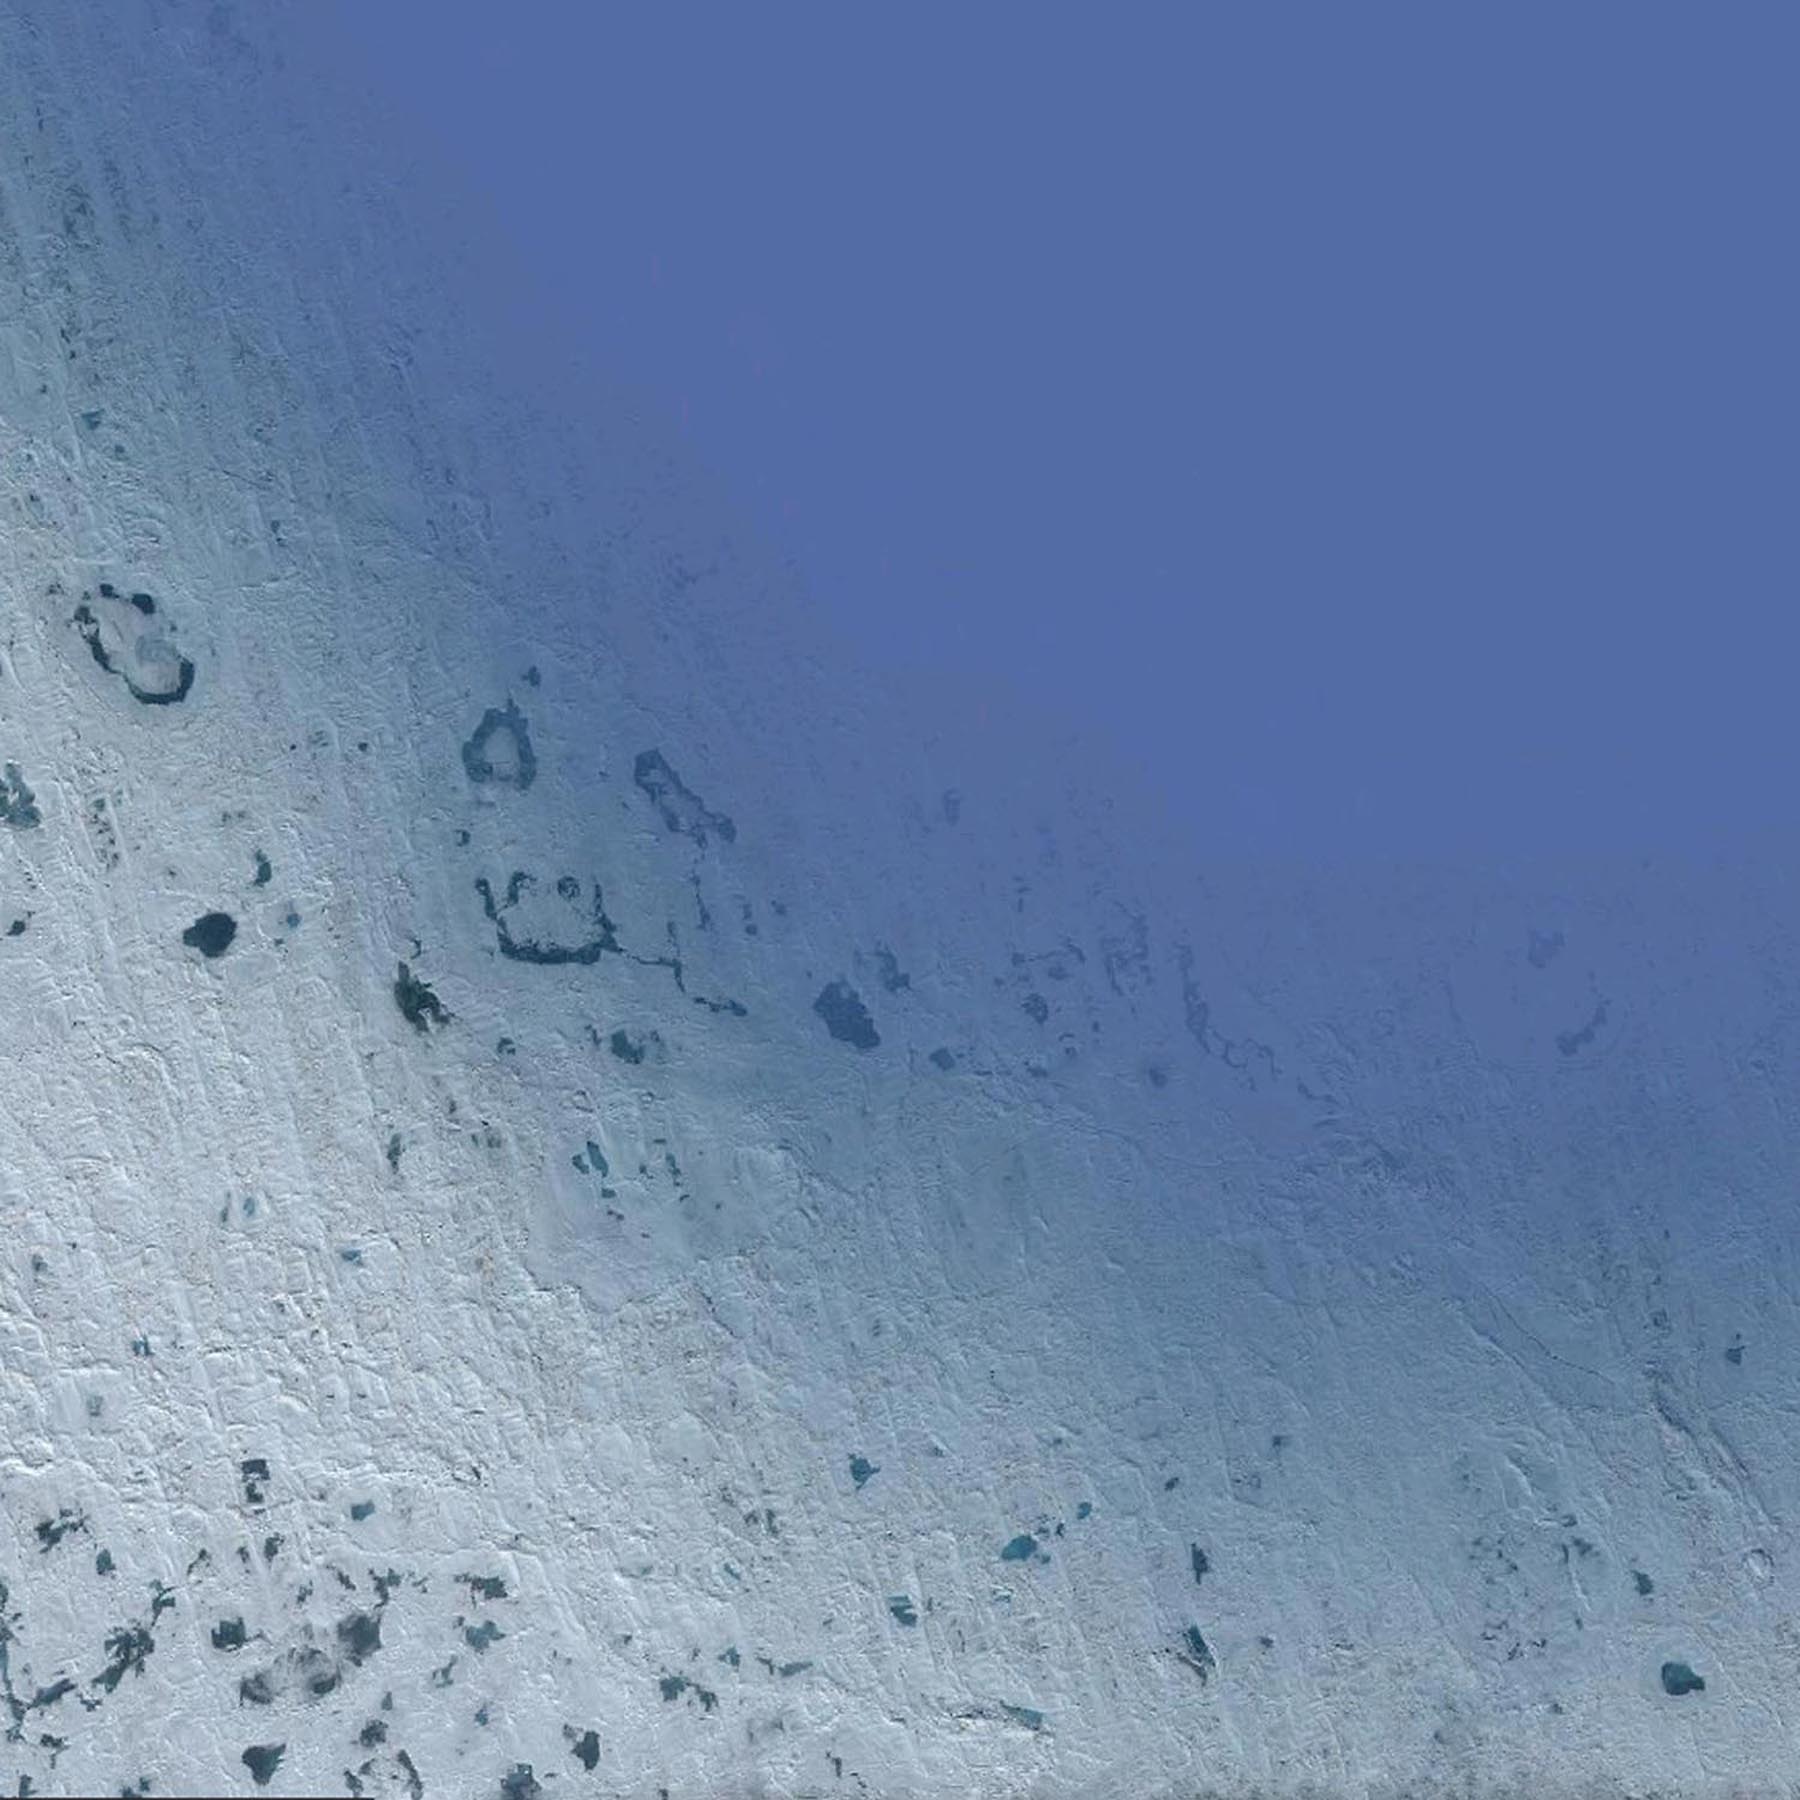
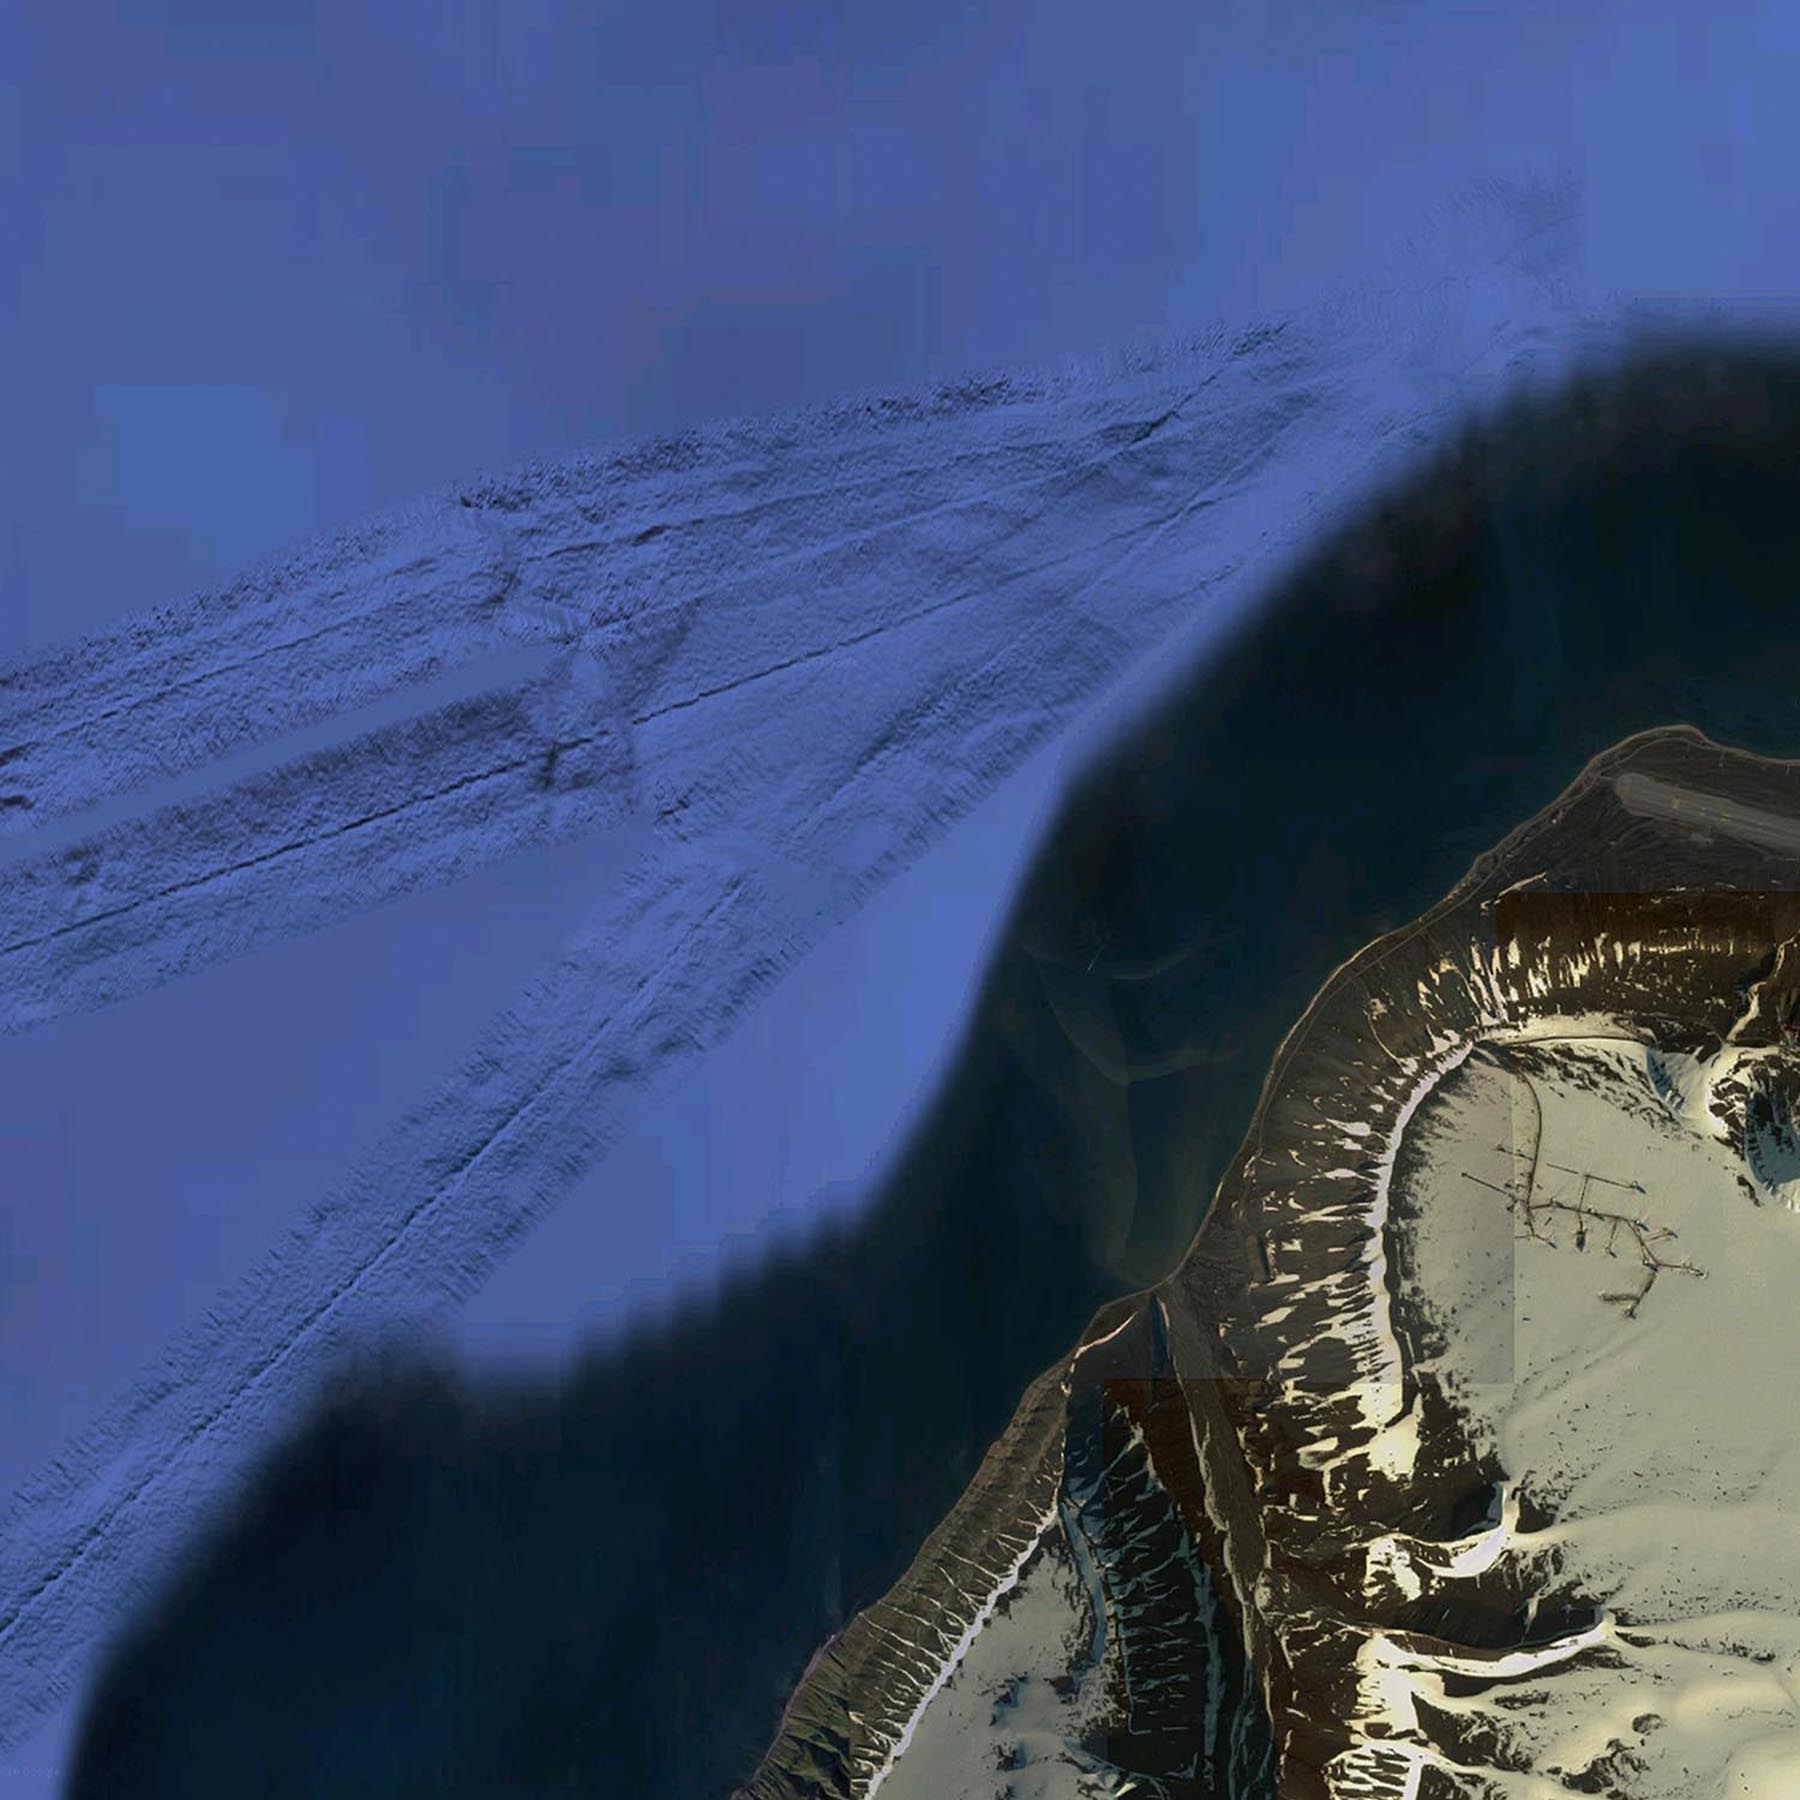
Samples from the Svalbard archipelago’s mosaic (source: Google)
The ground station run by KSAT is the world’s most important satellite control centre. Svalsat sits both at the centre and at the edge of the modern cartographic space: on one side, its latitude ensures the most optimal location to intercept polar-orbiting satellites; on the other, polar caps are very difficult to sense—it can take up to five years to have a fully updated mosaic of a region that would be otherwise covered by 10 Landsat scenes. The Svalbard archipelago offers a unique opportunity to investigate the production chain of the global geographic knowledge: by looking at it through a catalogue of the anomalies, fractures, and aberrations of the satellite imagery mosaic, one can read beyond the apparent smoothness of the charted globe.
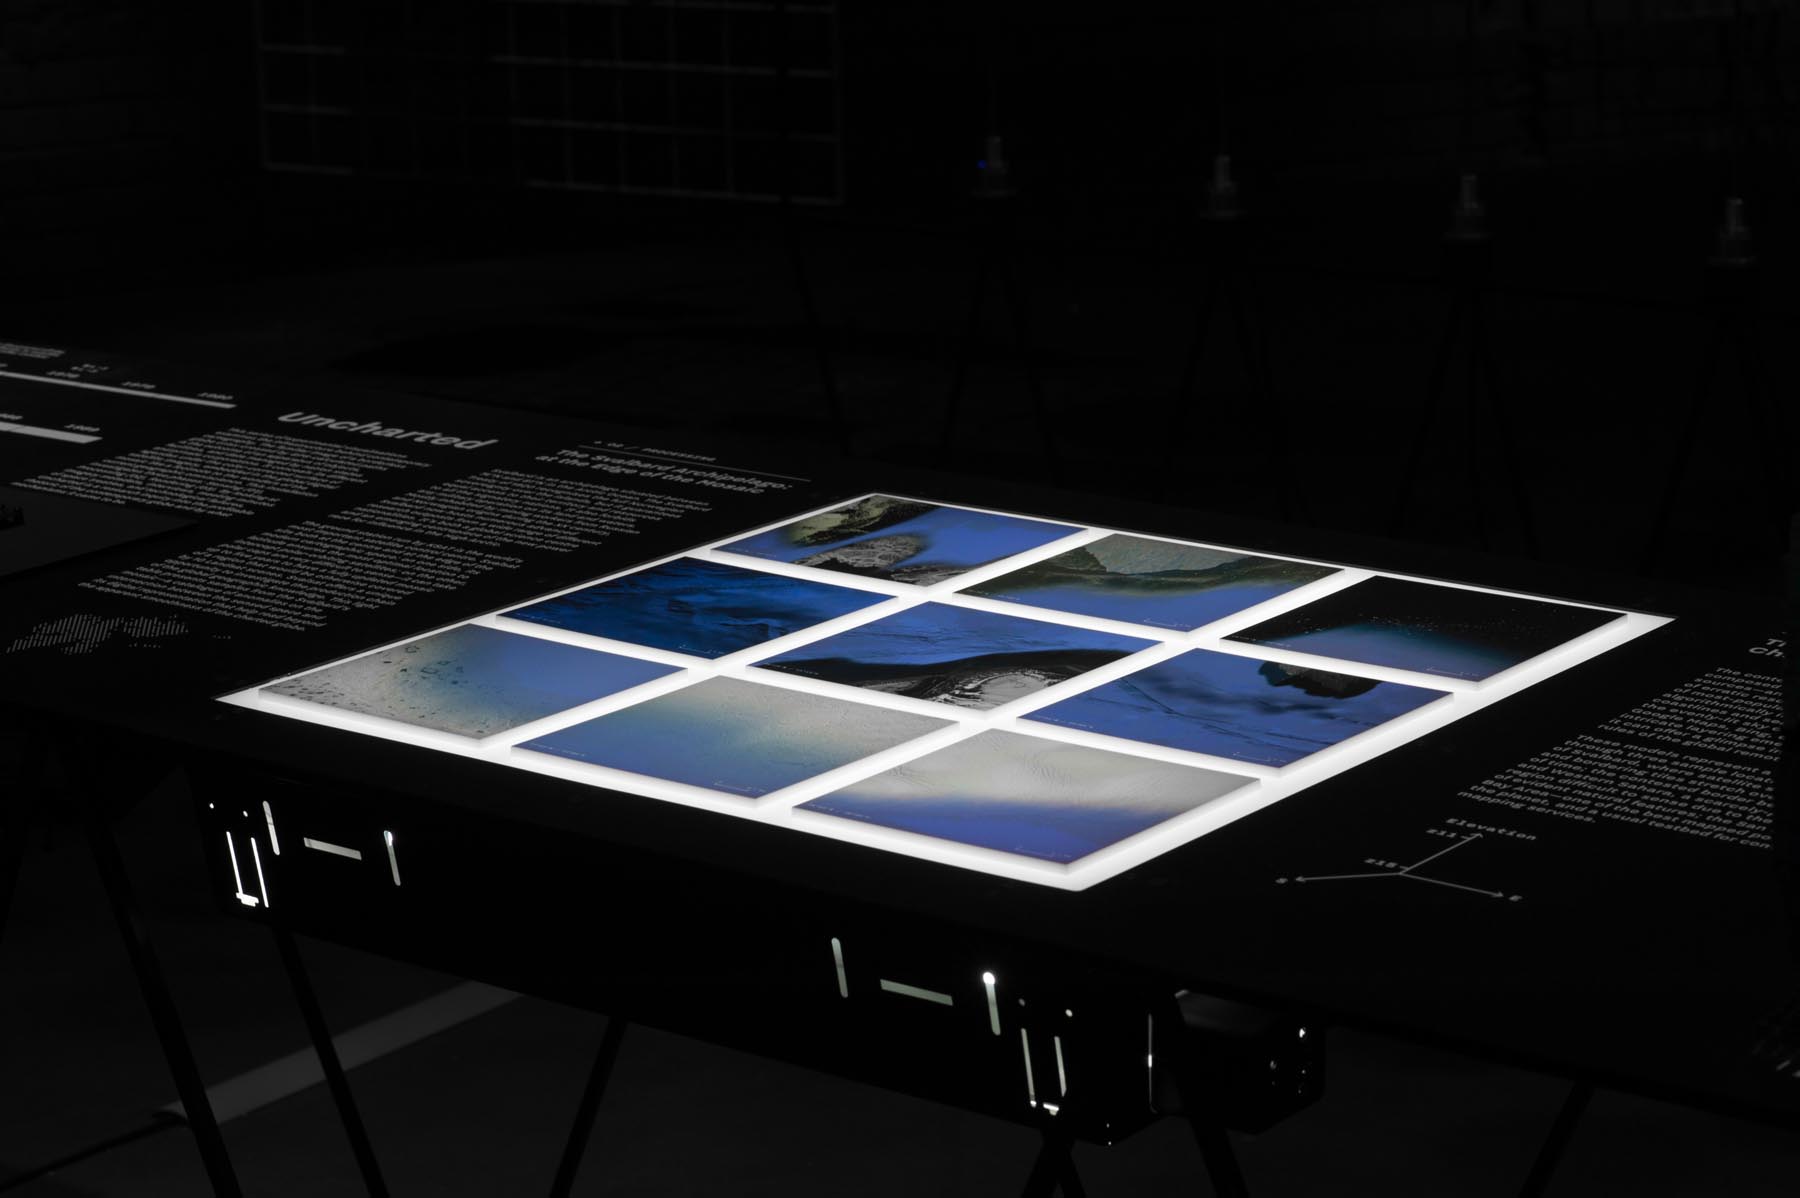
At the edge of the mosaic: a catalogue of anomalies, fractures, and aberrations. Detail view of the Uncharted installation as part of After Belonging, Oslo Architecture Triennale 2016 (September 8th–November 27th, 2016)
The contemporary atlas is a cloudless mosaic composed by imagery from a variety of sources—an asynchronous composition of erratic resolutions, where the sharpness of most-populated areas decay into the algorithmically interpolated gloom of coastlines and seabeds. By zooming across the evenly-lit sky of mapping services like Google Maps, Bing, or Apple Maps, this intricate layering emerges: if visualised, it can offer a glimpse into the structure and rules of the global remote sensing apparatus.
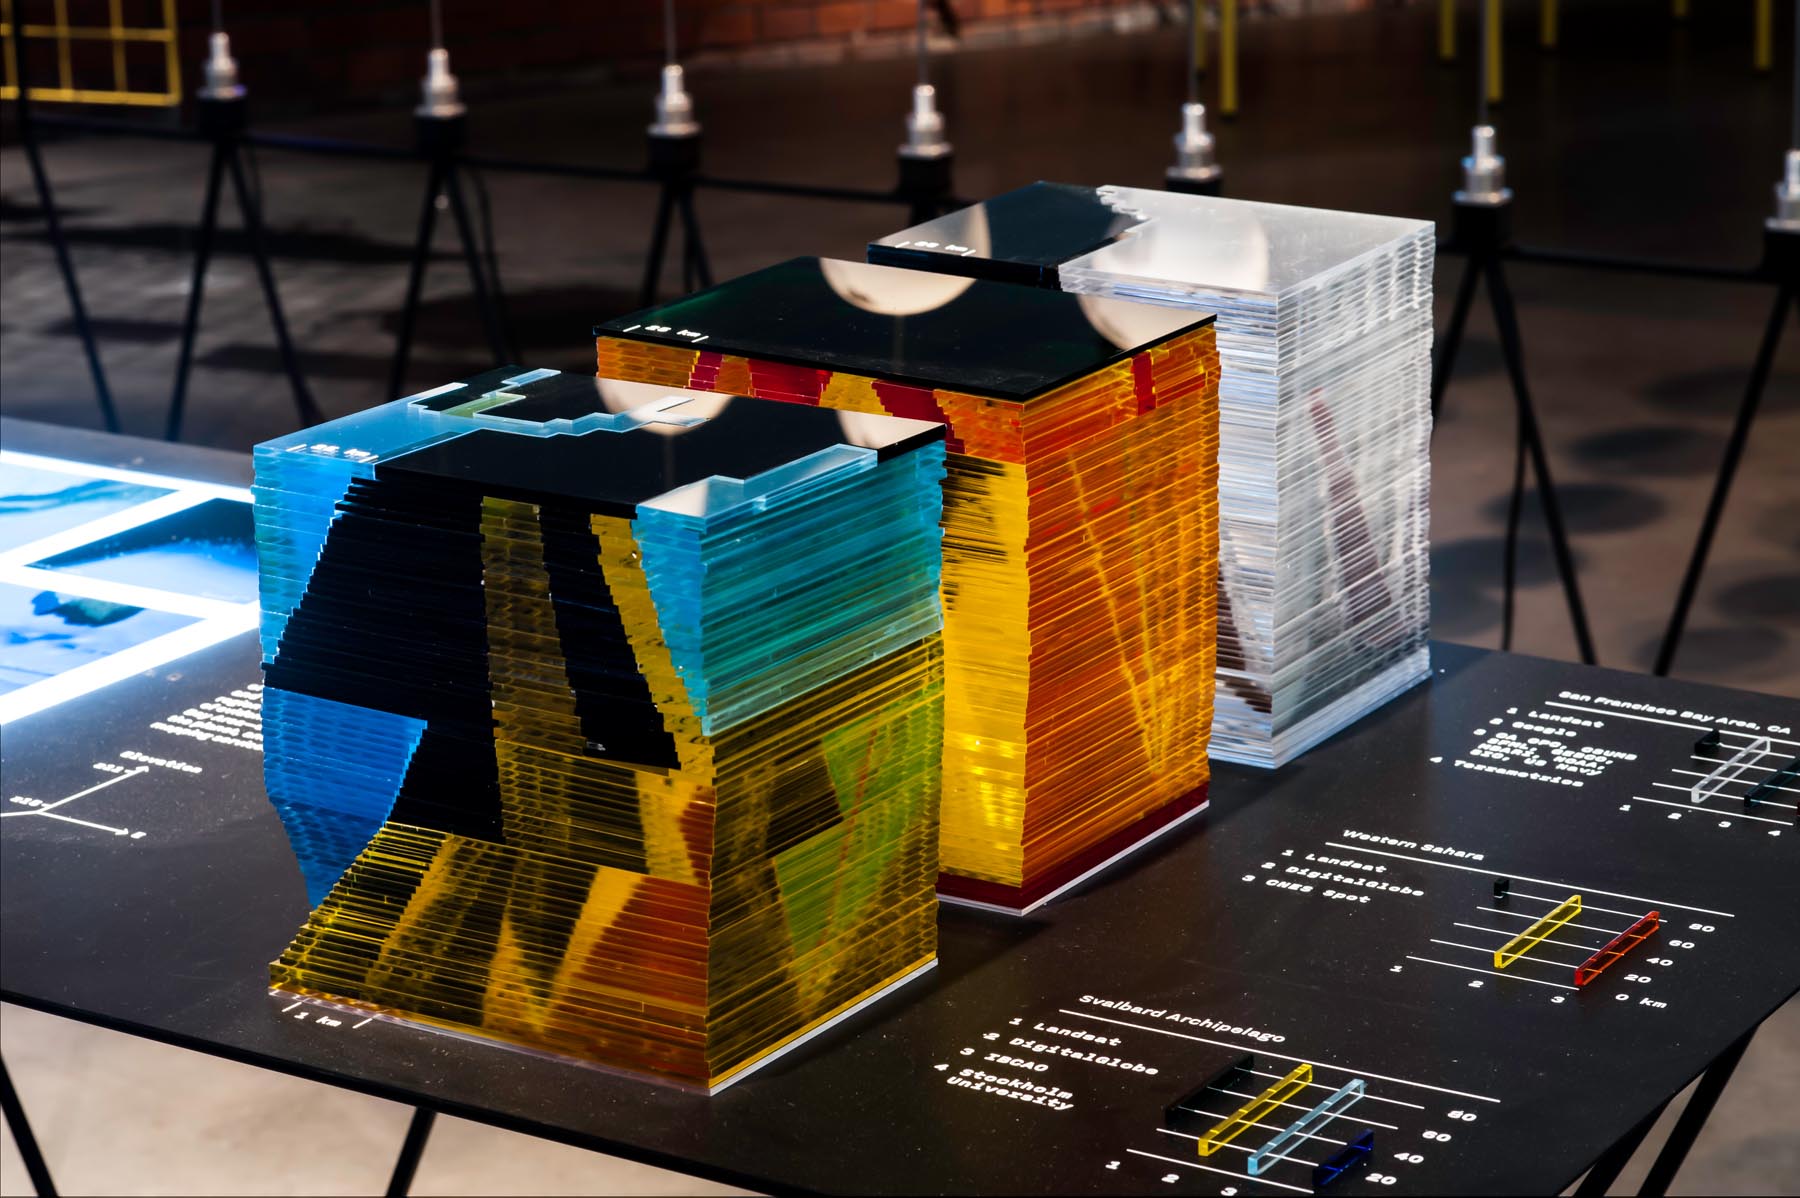
Three models were assembled as a vertical section through the sky above three sample locations: the territory of Svalbard, where satellite scans are scarce and bordering tiles stretch over long periods of time; the contested border between Morocco and Western Sahara, a scarcely-populated region difficult to sense due to the absence of evident natural features; the San Francisco Bay Area—one of the best mapped portions of the planet, and a usual testbed for commercial mapping services.
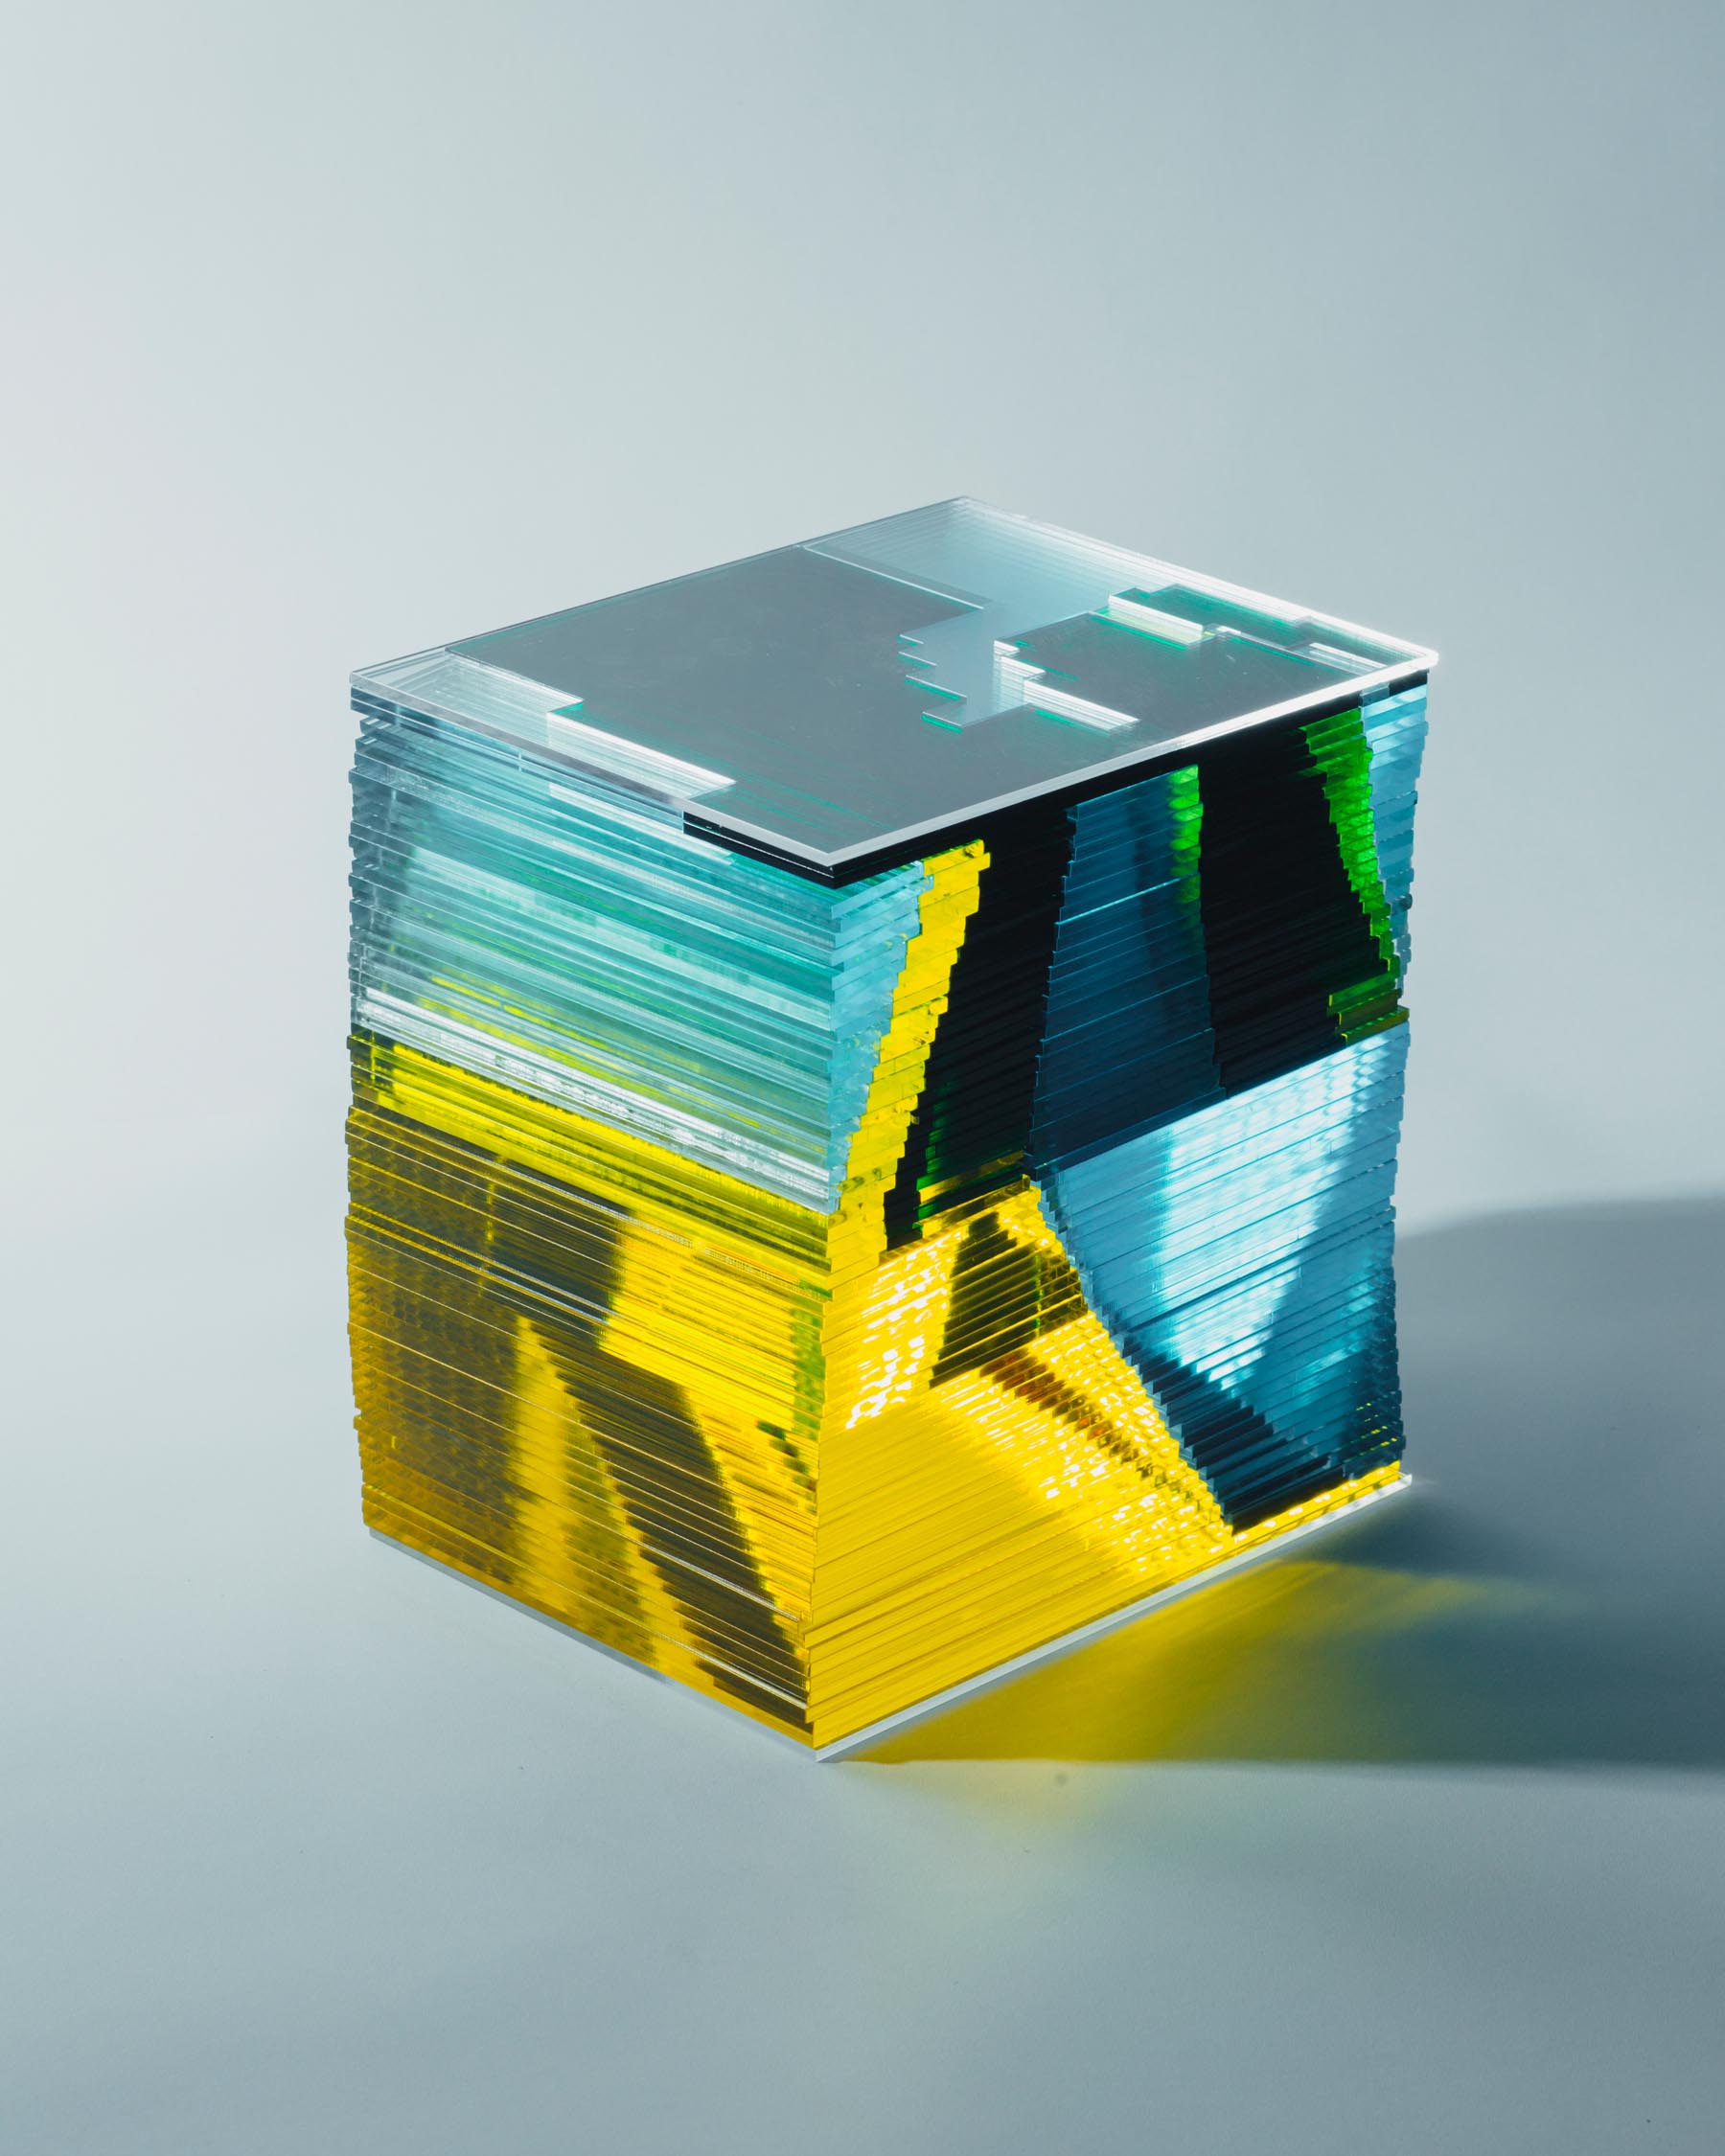
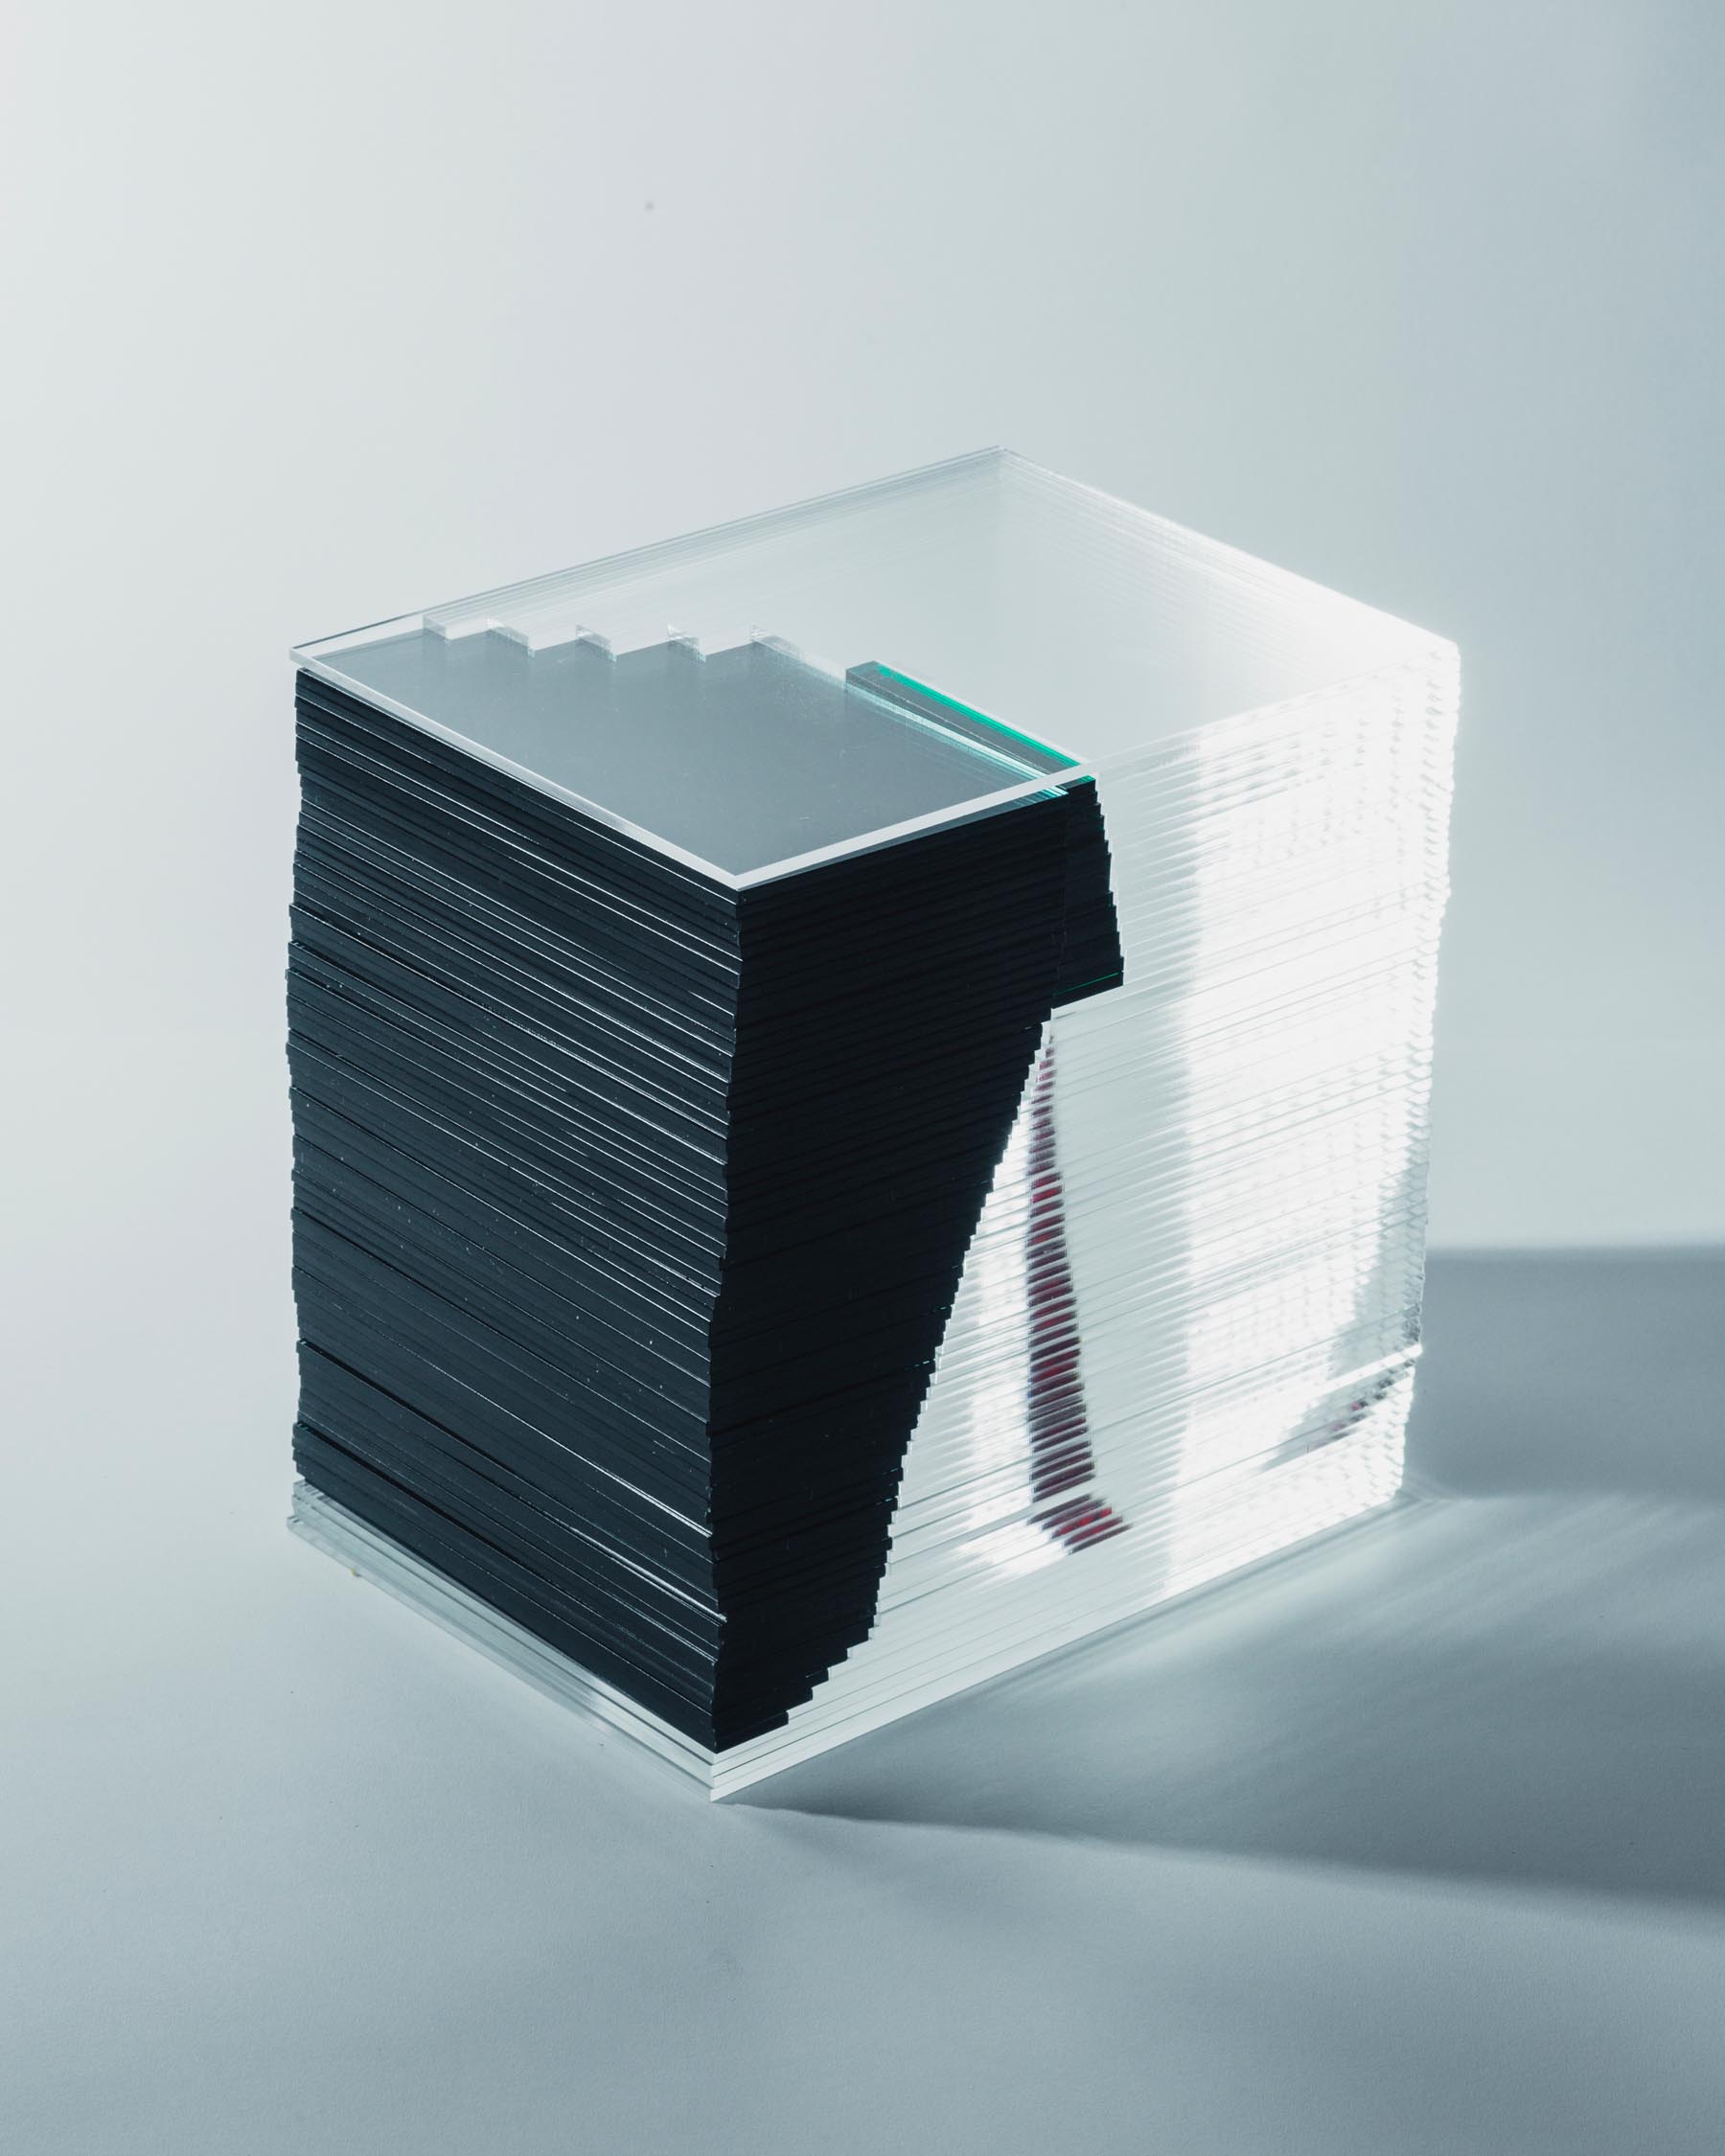
By keeping a fixed view on a framed portion of territory (the Svalbard archipelago on the left, the San Francisco Bay Area on the right), and zooming away from the Earth’s surface up to an altitude of 80 km, these three-dimensional projections cuts through the sky of contemporary cartographic databases, revealing how different image sources are combined into a global mosaic—a scattered view divergent from the seamless satellite view usually rendered on screen (data source: Google / photo: Mattia Balsamini)
By keeping a fixed view on a framed portion of territory of the Svalbard archipelago, and zooming away from the Earth’s surface up to an altitude of 80 km, these three-dimensional projections cuts through the sky of contemporary cartographic databases, revealing how different image sources are combined into a global mosaic—a scattered view divergent from the seamless satellite view usually rendered on screen (data source: Google / photo: Mattia Balsamini)
By browsing through the imagery’s metadata on Google Earth, it was possible to understand the composition of the vertical mosaic, and how different image providers and sources are covering the Earth’s surface from different altitudes and at different resolutions. Landsat, DigitalGlobe and Spot Image (just to name a few) all have constellations of specialized satellites that provide different combinations of resolution, light spectrum and periodicity between satellite overpasses.
Uncharted is an ongoing research project. We’re looking for contributors, collaborators and institutions to help us developing this project further and expand its potential. Write us if you want to get in touch.
Uncharted—Footnotes to the Atlas is an installation originally commissioned by the After Belonging Agency (Lluís Alexandre Casanovas Blanco, Ignacio González Galán, Carlos Mínguez Carrasco, Alejandra Navarrete Llopis, Marina Otero Verzier), curators of the Oslo Architecture Triennale 2016, as part of the "On Residence" exhibition at DOGA Norwegian Centre for Design and Architecture (September 8th–November 27th, 2016).
Research and design: Folder (Marco Ferrari, Elisa Pasqual, Alessandro Busi, Aaron Gillett, Pietro Leoni, Francesca Lucchitta, Giovanni Pignoni, Mariasilvia Poltronieri) / Design and production: Folder and Gisto (Alessandro Mason) / Special thanks to Giovanni De Francesco.